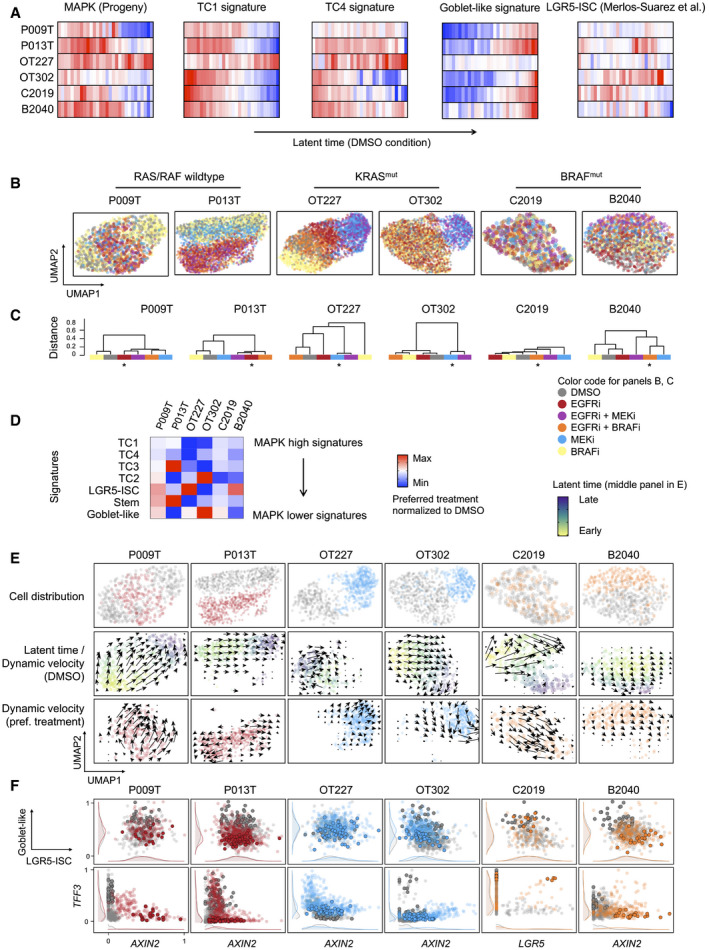
Figure 6. Anti‐MAPK therapy re‐routes developmental trajectories in CRC organoids.

- Activities of gene expression signatures, as indicated, in single‐cell transcriptomes from control (DMSO) condition CRC organoids, ordered along latent time. Correlation between cell state distributions and latent time was calculated using Pearson’s r. For correlations and significances, see Table EV6. Color code red: high activity; blue: low activity.
- UMAPs of organoid single‐cell transcriptomes, color‐coded by treatment conditions, as indicated.
- Dendrograms of transcriptome similarities across treatment conditions, per organoid line. Height of dendrogram is obtained by hierarchical clustering on the overlap of KNN neighborhoods across conditions. Preferred treatment conditions are marked by asterisk.
- Heatmap of signature gene expression, from scRNA‐seq data. Average activities of gene signatures are given as log fold change for preferred treatment condition, after normalization to DMSO control condition. Range of color scale was adjusted for each signature.
- RNA velocity analysis of organoids under DMSO and preferred treatment conditions. Latent time is given as color code in the control (DMSO) condition UMAP, dynamical velocities are displayed as arrows.
- Scaled signature expression and single gene expression moments per cell, under control (gray) and preferred treatment (color) conditions, as indicated. 10% of cells populating the end of latent time are displayed in bold. It is of note that latent time is linear and thus cannot capture multiple populations located at developmental end points. Densities at the sidelines display expression in all cells.
