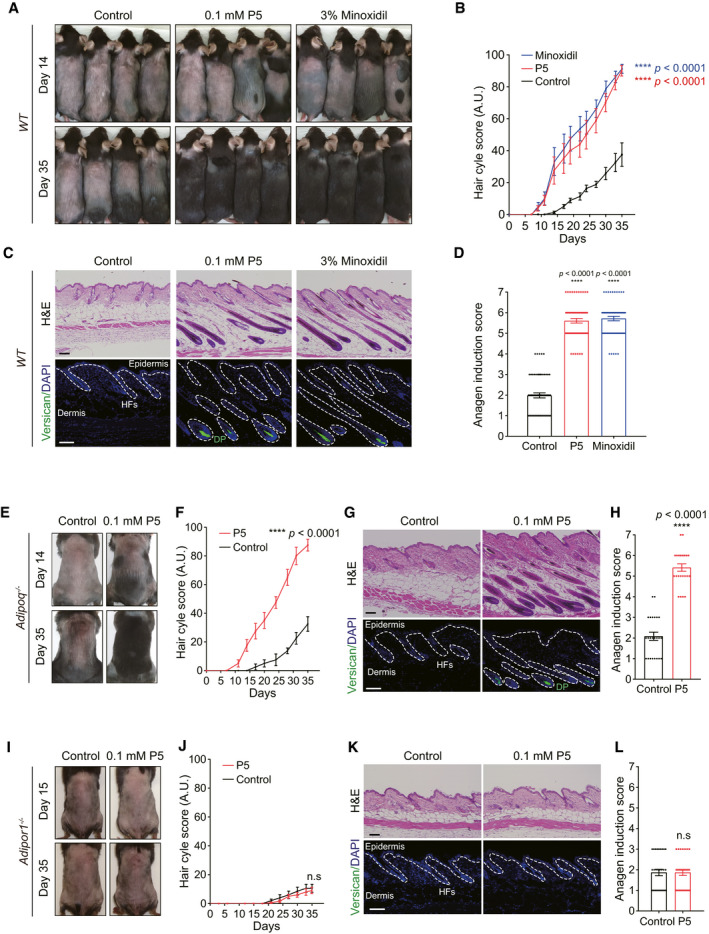
Figure 4. Topical P5 treatment induced the anagen hair cycle through AdipoR1 in vivo .

- Gross morphology of vehicle‐, P5‐, or minoxidil‐treated WT mice.
- Hair cycle scores of vehicle‐, P5‐, or minoxidil‐treated WT mice (n = 16 mice/group); Two‐way ANOVA with Dunnett's test compared to the control group.
- H&E and IF for versican of skin tissue; scale bars: 100 µm.
- Anagen induction scores of vehicle‐, P5‐, or minoxidil‐treated WT mice (n = 4 tissues/mice, four mice/group); One‐way ANOVA with Tukey's test compared to the control group.
- Gross morphology of vehicle‐, or P5‐treated Adipoq −/− mice.
- Hair cycle scores of vehicle‐, or P5‐treated Adipoq −/− mice (n = 4 mice/group); Two‐way ANOVA.
- H&E and IF for versican of skin tissue; scale bars: 100 µm.
- Anagen induction scores of vehicle‐, or P5‐treated Adipoq −/− mice (n = 6 tissues/mice, four mice/group); Unpaired t‐test.
- Gross morphology of vehicle‐, or P5‐treated Adipor1 −/− mice.
- Hair cycle scores of vehicle‐, or P5‐treated Adipor1 −/− mice (n = 5 mice/group); Two‐way ANOVA.
- H&E and IF for versican of skin tissue; scale bars: 100 µm.
- Anagen induction scores of vehicle‐, or P5‐treated Adipor1 −/− mice (n = 6 tissues/mice, five mice/group); Unpaired t‐test.
Data information: All values are presented as the mean ± SEM.
Source data are available online for this figure.
