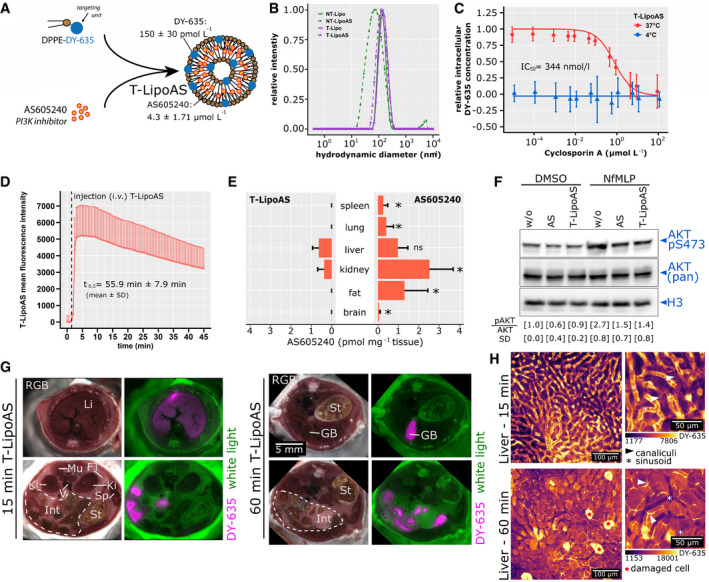
Scheme for the preparation of DY‐635 targeted liposomes containing the PI3Kγ inhibitor AS605240 (T‐LipoAS). LC‐MS determined concentrations of AS605240 and DY‐635 individually prepared batches used for all subsequent experiments. The graph depicts the mean ± SD from five different batches.
Hydrodynamic diameters of different liposomes in histidine buffer were analyzed by dynamic light scattering. The graph depicts representative plots obtained from dynamic light scattering in Histidine buffer. Further, all batches in this study have been analyzed for size by the manufacturer using DLS and were confirmed to be stable in solution for at least one year.
Uptake characteristics of T‐LipoAS by primary human hepatocytes demonstrate competitive inhibition by cyclosporin A‐ and energy dependence, confirming active uptake by organic anion transporters (OATPs). The data points are depicted mean ± SD from two batches of primary human hepatocytes in quadruples.
T‐LipoAS plasma disappearance rate in murine ear veins and estimated half‐life obtained by intravital microscopy. The mean fluorescence intensity averaged between the remaining 24 regions of interest (from n = 4 FVB/N mice) and the positive standard error depicted in the figure.
Quantification of AS60524060 min after injection of 1 mg/kg AS605240 (i.p. in DMSO, n = 4 animals) or 2.5 mg/kg T‐LipoAS (i.v. n = 5 animals) in tissue lysates quantified by LC‐MS. Bars depict the mean + SD for each group. *P < 0.05 for Wilcoxon test between T‐LipoAS and AS605240 in each tissue.
T‐LipoAS effectively inhibits fMLP‐stimulated PI3Kγ, reflected by inhibiting AKT S473 phosphorylation activity in hepatocytes from three different batches. The mean pAKT/AKT ratio and standard deviation (SD) were calculated for all experiments separately.
Episcopic imaging of mice treated with T‐LipoAS for 15 or 60 min and relative concentration of the targeting moiety DY‐635 in the different compartments.
Intravital microscopy to monitor T‐LipoAS kinetics in the liver. Liposomes appear in the sinusoidal vasculature after 5–15 min and accumulate within hepatocytes. After 35–60 min, the bile canalicular system appears stained, indicating the processing and elimination of the targeting moiety (DY‐635) from T‐LipoAS. Similar distribution patterns had been observed in all repetitions (n = 7).

