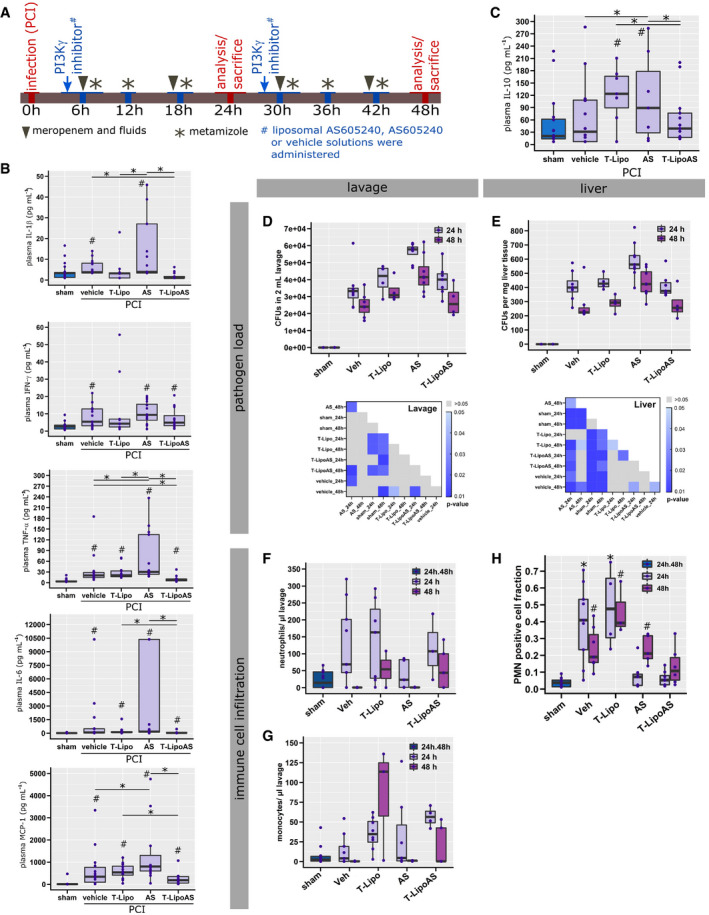
Figure 3. Targeted delivery of AS605240 prevents untoward effects on the innate immune response to peritonitis.

-
AGraphical summary of the murine sepsis model and experimental design.
-
B, CPro‐ (B) and anti‐inflammatory (C) cytokines were analyzed in EDTA‐plasma from peritoneal contamination and infection (PCI) and sham animals. # P < 0.05 against sham, *P < 0.05 as indicated; Kruskal–Wallis ANOVA with controlled false‐discovery rates (Benjamini–Hochberg procedure).
-
D, EColony‐forming units (CFUs) were analyzed from (D) abdominal lavage and (E) liver homogenates. Significance maps depict P‐values from a Kruskal–Wallis ANOVA with controlled false‐discovery rates applying the Benjamini‐Hochberg procedure.
-
F, GConcentration of (F) neutrophils and (G) monocytes in 2 ml peritoneal lavage.
-
HInfiltrating polymorphonuclear neutrophils (PMN) were assessed from histological liver sections after immune fluorescent staining. *P < 0.05 against sham, # P < 0.05 against 24 h; Kruskal–Wallis ANOVA with controlled false‐discovery rates (Benjamini‐Hochberg procedure).
Data information: (B–H) The data are depicted as box plots with median (line). The box describes the [Q1 = 0.25, Q3 = 0.75] interquartile range (IQR), and whiskers the range as following: Q1–1.5*IQR and Q3 + 1.5 IQR. Each data point depicts the result from an individual animal.
