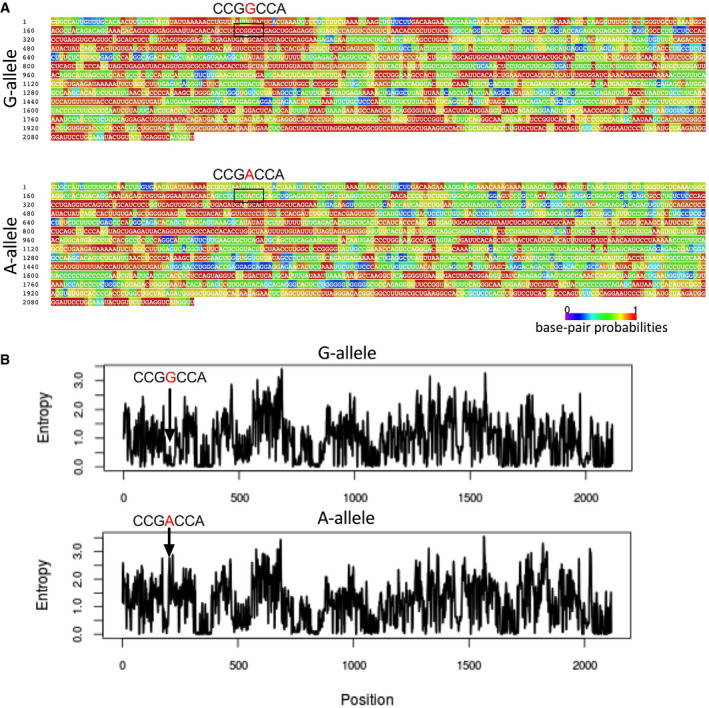
Figure EV1. Thermodynamic analysis of the miR‐143/145 primary sequence.

-
ABase pair annealing probability using a centromeric prediction algorithm was carried out for the G‐ and A‐allele sequences (the base in red indicates the variation).
-
BEntropy level profiles of the G‐ and A‐allele transcripts.
