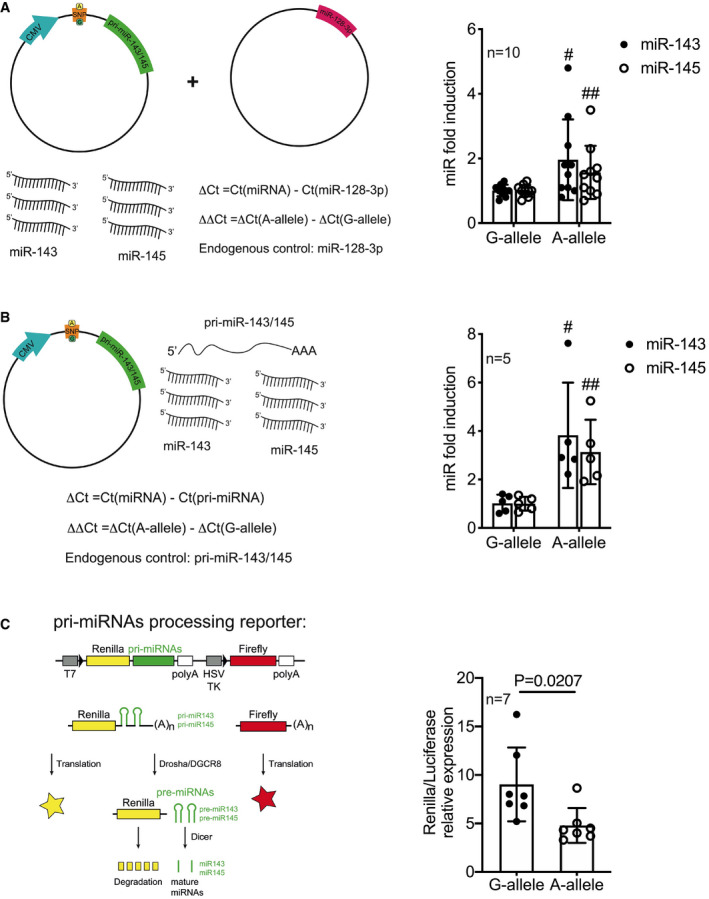
Figure 3. Mature miR‐143 and miR‐145 levels are increased by the presence of the A‐allele.

-
ACartoon showing the method utilized to quantify miR‐143 and miR‐145 levels in the presence of the A‐allele (left). Mature miRNA level quantification (RT–qPCR) in HEK‐293T cells transfected with vectors carrying the G‐ or A‐allele and normalized on miR‐128 (n = 10; right).
-
BCartoon showing the method utilized to quantify miR‐143 and miR‐145 maturation levels in the presence of the A‐allele (left). Mature miRNA level quantification (RT–qPCR) in HEK‐293T cells transfected with vectors carrying the G‐ or A‐allele and normalized on pri‐miR‐143/145 (n = 5; right).
-
CCartoon showing the reporter construct method utilized to quantify miR‐143 and miR‐145 processing (left). Quantification in HCASMCs transfected with vectors carrying the pri‐miR‐143/145 as 3′UTR G‐ or A‐allele and normalized on Luciferase signal (n = 7; right).
Data information: Data are shown as mean ± standard deviation (SD), and n indicates the number of biological replicates. To compare means, unpaired Student’s t‐test was used, considering data from G‐allele as control; For A: # P = 0.0286, ## P = 0.0456; For B: # P = 0.004, ## P = 0.000006.
