
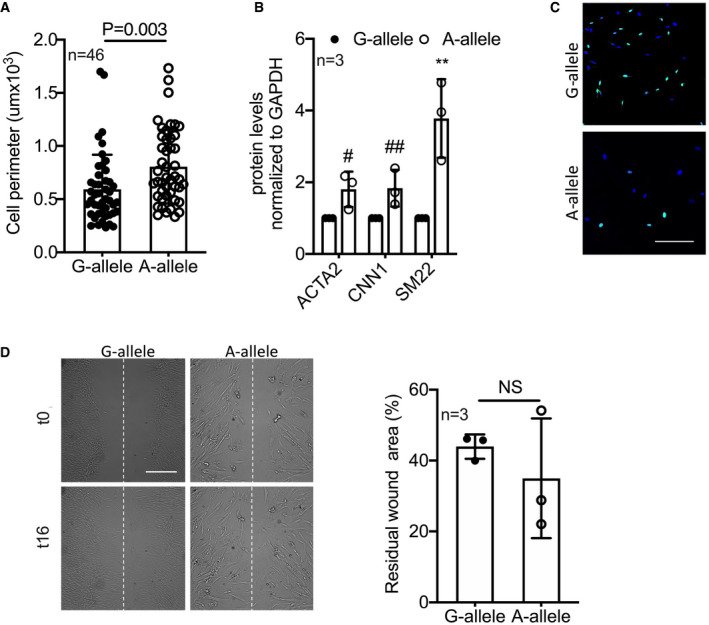
Figure EV3. HCASMC biological feature analysis.
-
AQuantification of the perimeter of HCASMCs carrying the G‐ and A‐allele (n = 46).
-
BQuantification of Western blots in Fig 6G (n = 3).
-
CRepresentative picture of BrdU incorporating HCASMCs. Scale bar: 50 μm.
-
DMigration properties measured by scratch (n = 3). Scale bar 250 μm.
Data information: Data are shown as mean ± standard deviation (SD), and n indicates the number of biological replicates. To compare means, unpaired Student’s t‐test was used considering data from G‐allele as control. For B: # P = 0.0048, ## P = 0.0047, **P = 0.011. NS: not statistically significant.