
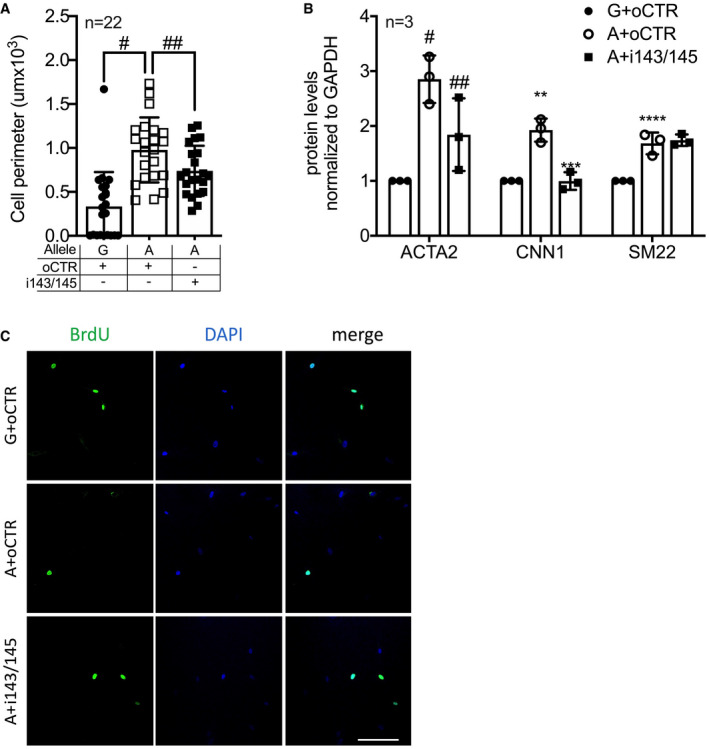
Figure EV4. miR‐143 and miR‐145 inhibition affects HCASMCs biological features.
-
AQuantification of size of HCASMCs carrying either the G‐ or A‐allele transfected with a control oligonucleotide (oCTR) or after miR‐143/145 inhibition (i143/145) (n = 22).
-
BQuantification of Western blots in Fig 7E (n = 3).
-
CRepresentative picture of BrdU incorporation. Scale bar: 50 μm.
Data information: Data are shown as mean ± standard deviation (SD), and n indicates the number of biological replicates. To compare means, one‐way ANOVA with Tukey’s multiple comparisons test was used. For A: #Adj P = 0.0001, ##Adj P = 0.0475; For B: #Adj P = 0.032, ##Adj P = 0.033, **Adj P = 0.03, ***Adj P = 0.025, ****Adj P = 0.048.