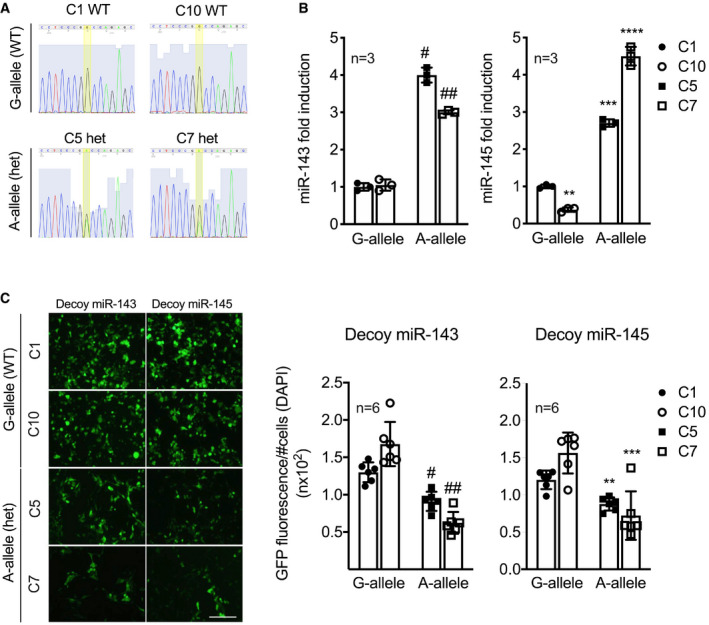
Figure 5. Genetically modified HEK‐293T cells carrying the rs41291957 variant and effect on miR‐143/145 levels.

-
ASanger sequence profiles of the CRISPR/Cas9‐mutated clones.
-
BLevels of miR‐143 and miR‐145 measured by RT–qPCR (n = 3).
-
CHEK‐293T clones were transduced with decoy miR‐143 and miR‐145 constructs. Then, 48‐h post‐infection, images were taken and processed: the GFP signal was quantified and normalized by the number of cells (DAPI) (n = 6). Scale bar: 50 μm.
Data information: Measurements were calculated as per cent of control (C1) as reference. Data are shown as mean ± standard deviation (SD), and n indicates the number of biological replicates. To compare means, one‐way ANOVA with Dunnett's multiple comparisons test was used in B and C. For B: #Adj P = 7 x 10⁻⁴, ##Adj P = 3.6 × 10⁻³, **Adj P = 0.017, ***Adj P = 5.6 × 10⁻⁴, ****Adj P = 4.7 × 10⁻³; For C: #Adj P = 0.011, ##Adj P = 1.4 × 10⁻⁴, **Adj P = 9.8 × 10⁻³, ***Adj P = 0.031. WT, wild‐type clones; het, heterozygote G/A clones.
