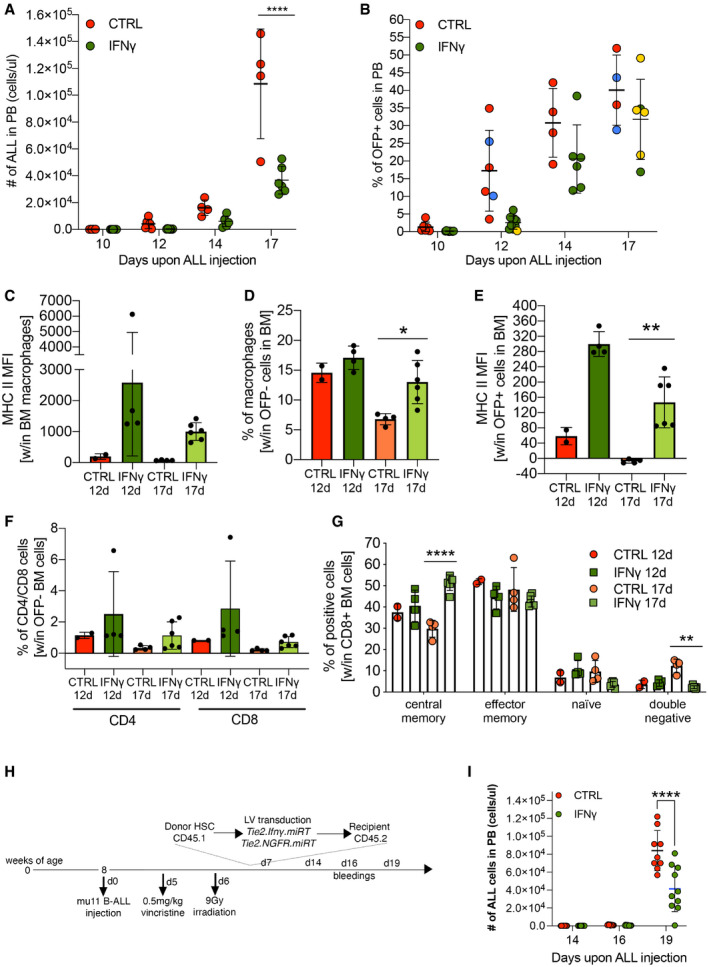
Figure 1. B‐ALL growth in the presence of gene therapy‐based delivery of IFN‐γ.

-
A, BB‐ALL progression measured as (A) absolute number or (B) percentage of OFP+ cells in the peripheral blood of transplanted mice (mean ± SD, each dot represents an individual mouse, CTRL = 6 mice, IFN‐γ = 10 mice; ****P ≤ 0.001, two‐way ANOVA; mice in blue and yellow (B) were also analyzed by single‐cell RNA sequencing; two additional independent experiments are shown in Fig EV2A).
-
C, DMean fluorescence intensity (MFI) of MHC II on macrophages (C) and their percentage (D) within the BM immune infiltrate at 12 and 17 days after B‐ALL injection (mean ± SD, each dot represents an individual mouse; *P = 0.0145, two‐way ANOVA).
-
EMFI of MHC class II on OFP+ B‐ALL cells at the experimental endpoint in the BM of transplanted mice, 12 and 17 days post‐leukemia injection (mean ± SD, each dot represents an individual mouse; **P ≤ 0.01, two‐way ANOVA).
-
F, GPercentage of CD4+ and CD8+ T cells within OFP− BM cells (F) and maturation state (G) of CD8+ lymphocytes (CD62L−CD44− double negative, CD62L−CD44+ effector memory, CD62L+CD44− naive and CD62L+CD44+ central memory T cells) in the BM immune infiltrate at 12 and 17 days after B‐ALL challenge (mean ± SD, each dot represents an individual mouse; **P = 0.005, ****P ≤ 0.001, two‐way ANOVA).
-
HExperimental overview of a therapeutic B‐ALL model. Replicate experiments are shown in Fig EV3A and B.
-
IAbsolute numbers of B‐ALL cells in the peripheral blood (PB) of CTRL‐ and IFN‐γ‐treated animals at the indicated time‐point (mean ± SD, each dot represents an individual mouse, CTRL = 9 mice, IFN‐γ = 10 mice; ****P ≤ 0.001, two‐way ANOVA).
Statistical analyses of panels (A) and (I) are shown in Appendix Tables S4 and S5, respectively.
