-
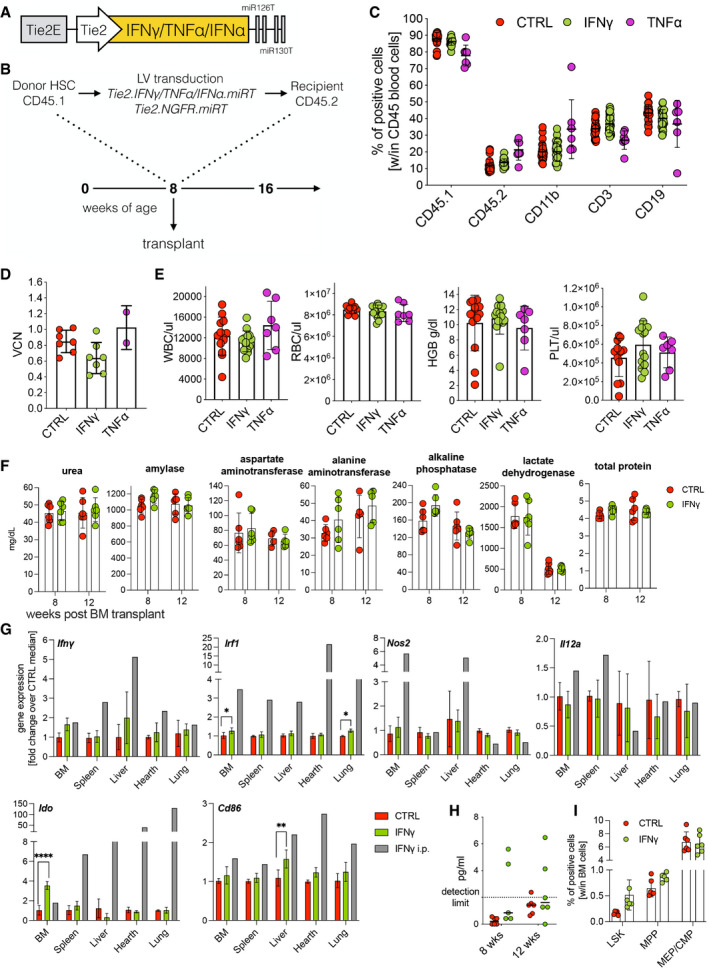
A
Third‐generation SIN lentiviral vector expression cassette driven by a Tie2 enhancer/promoter (Tie2E, Tie2) and post‐transcriptionally regulated by two couples of target sites for microRNA‐126 and ‐130a (miR‐126T, miR‐130aT).
-
B
Experimental design of genetically‐modified HSPC transplants followed by challenge with B‐ALL.
-
C
Engraftment of CD45.1 donor cells and lineage composition in the blood, as assessed by flow cytometry (mean ± SD, each dot represents an individual mouse, two experiments, CTRL = 12 mice, IFN‐γ = 14 mice, TNF‐α = 7 mice).
-
D
Vector copy number (VCN) in peripheral blood at 8 weeks post‐transplantation (mean ± SD, each dot represents a pool of 2–3 mice, two experiments).
-
E
From left to right: white blood cell count (WBC), red blood cell count (RBC), hemoglobin concentration (HGB), and platelet count (PLT) measured by hemocytometer (mean ± SD, each dot represents an individual mouse, two experiments, CTRL = 12 mice, IFN‐γ = 14 mice, TNF‐α = 7 mice).
-
F–I
Mice were transplanted with Tie2.NGFR‐ (CTRL) (n = 6) or Tie2.IFN‐γ‐ (IFN‐γ) (n = 6) transduced Lin‐ cells and evaluated for potential IFN‐γ‐related toxicity. (F) Serum biochemistry at 8 and 12 weeks after transplantation (mean ± SD, each dot represents an individual mouse). (G) Gene expression levels of Ifnγ and IFN‐γ‐related genes in several organs at steady state at 12 weeks after transplantation (mean ± SD; *P = 0.0182 for BM, *P = 0.0129 for lung, **P = 0.0044, ****P ≤ 0.0001, ordinary two‐way ANOVA) The gray bar shows a single mouse that was systemically (i.p., intraperitoneally) injected with recombinant murine IFN‐γ. (H) IFN‐γ protein quantification (ELISA) in the plasma of transplanted mice (each dot represents an individual mouse). (I) Bar graphs showing the frequency of HSPC subpopulations in the BM. LSK (CD45+ Lin− Sca1+ CD117+ CD34− CD150+), MPP (CD45+ lin− Sca1+ CD117+ CD34+), MEP/CMP (CD45+ lin− Sca1− CD117+); mean ± SD, each dot represents an individual mouse.