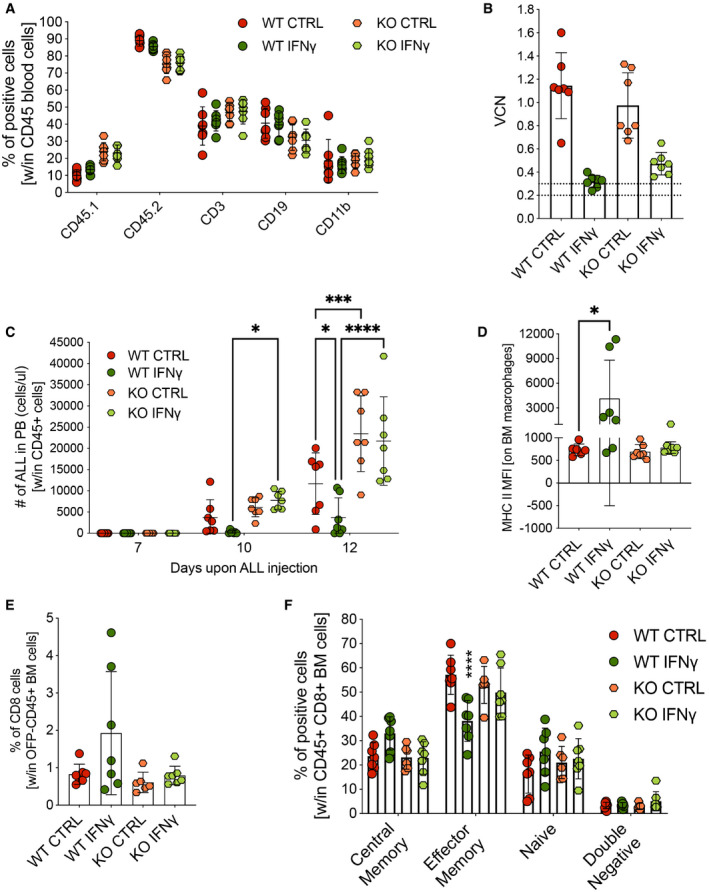
Figure 2. IFN‐γR1 knockout HSPCs display loss of IFN‐γ anti‐tumoral activity.

- Engraftment of CD45.2 donor cells and lineage composition following transplantation of wild‐type (WT) or IFN‐γ receptor 1 knockout (KO) HSPCs transduced with either the control Tie2.NGFR (CTRL) or Tie2.IFN‐γ (IFN‐γ) LV (mean ± SD, each dot represents an individual mouse, WT CTRL = 7 mice, WT IFN‐γ = 7 mice, KO CTRL = 7 mice, KO IFN‐γ = 7 mice).
- Vector copy number (VCN) in peripheral blood at 8 weeks post‐transplantation (mean ± SD, each dot represents an individual mouse).
- B‐ALL progression measured as absolute number of OFP+ cells in the peripheral blood (mean ± SD, each dot represents an individual mouse; *P = 0.0286 at day 10; P = 0.0174 at day 12; ***P = 0.0002; ****P ≤ 0.0001; ordinary two‐way ANOVA).
- MFI of MHC class II‐positive macrophages, identified by F4/80 expression, in the BM (mean ± SD, each dot represents an individual mouse; WT IFN‐γ vs. WT CTRL: *P = 0.0221, Mann–Whitney test).
- Percentage of CD8+ T lymphocytes within OFP− CD45+ BM cells (mean ± SD, each dot represents an individual mouse).
- Maturation state (CD62L−CD44− double negative, CD62L−CD44+ effector memory, CD62L+CD44− naive and CD62L+CD44+ central memory T cells) of CD8+ lymphocytes (mean ± SD, each dot represents an individual mouse; WT IFN‐γ vs. WT CTRL: ****P ≤ 0.0001, ordinary one‐way ANOVA).
Data information: Statistical analysis of panel (C) is shown in Appendix Table S6.
