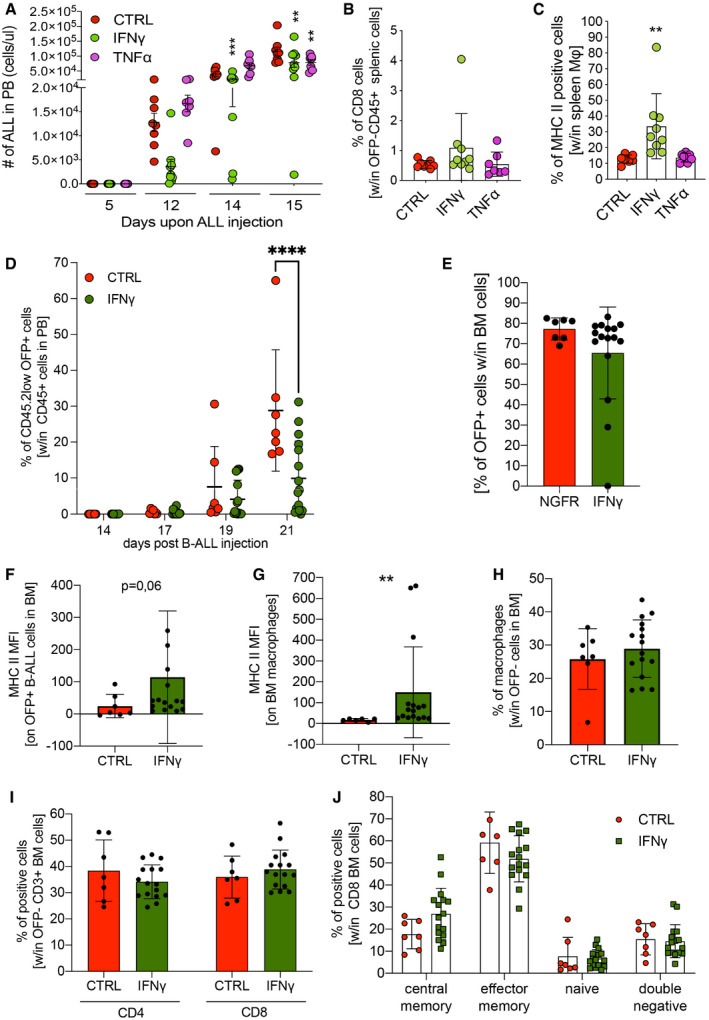
A–CMice were transplanted with Tie2.NGFR‐ (CTRL, n = 8 mice), Tie2.IFN‐γ‐ (IFN‐γ, n = 9 mice) or Tie2.TNF‐α‐ (TNF‐α, n = 7 mice) transduced Lin‐ cells and challenged with B‐ALL (line#11). (A) B‐ALL progression (line#11) measured as absolute number of OFP+ cells in the peripheral blood of transplanted mice (mean ± SD, each dot represents an individual mouse; **P = 0.0027 CTRL vs. IFN‐γ and **P = 0.0063 CTRL vs. TNF‐α, ***P = 0.0003, two‐way ANOVA). (B) Percentage of CD8+ T lymphocytes within OFP− CD45+ splenic cells (mean ± SD, each dot represents an individual mouse). (C) Percentage of MHC class II‐positive macrophages (Mφ), identified by F4/80 expression, in the spleen (mean ± SD, each dot represents an individual mouse; **P = 0.0063, ordinary one‐way ANOVA).
D–JMice were transplanted with Tie2.NGFR‐ (CTRL, n = 7 mice) or Tie2.IFN‐γ‐ (IFN‐γ, n = 16 mice) transduced Lin‐ cells, and challenged with an independently generated B‐ALL clone (line#8). (D) B‐ALL progression (line#8) in peripheral blood measured as the percentage of CD45.2low OFP+ cells within CD45+ cells (mean ± SD, each dot represents an individual mouse; ****P ≤ 0.0001, ordinary two‐way ANOVA with Geisser–Greenhouse correction). (E) B‐ALL burden in the BM measured as the percentage of CD45.2low OFP+ cells within CD45+ cells (mean ± SD, each dot represents an individual mouse). (F) Bar graphs showing MFI of MHC II on OFP+ B‐ALL cells in the BM (mean ± SD, each dot represents an individual mouse, P = 0.06, Mann–Whitney test). (G) Bar graphs showing the mean fluorescence intensity of MHC II on BM macrophages (identified as CD45.1+ OFP− CD11b+ F4/80+ cells) (mean ± SD, each dot represents an individual mouse; **P ≤ 0.01, Mann–Whitney test). (H) Bar graphs showing the percentage of macrophages within OFP− cells in the BM (mean ± SD, each dot represents an individual mouse; no significant differences were revealed by Mann–Whitney test). (I) Bar graphs showing the percentage of CD4+ or CD8+ T lymphocytes within OFP− CD3+ cells in the BM (mean ± SD, each dot represents an individual mouse; no significant differences were revealed by Mann–Whitney test). (J) Distribution of lymphocyte maturation stages within OFP− CD8+ T cells in the BM (mean ± SD, each dot represents an individual mouse; no significant differences were revealed by Mann–Whitney test).

