-
A
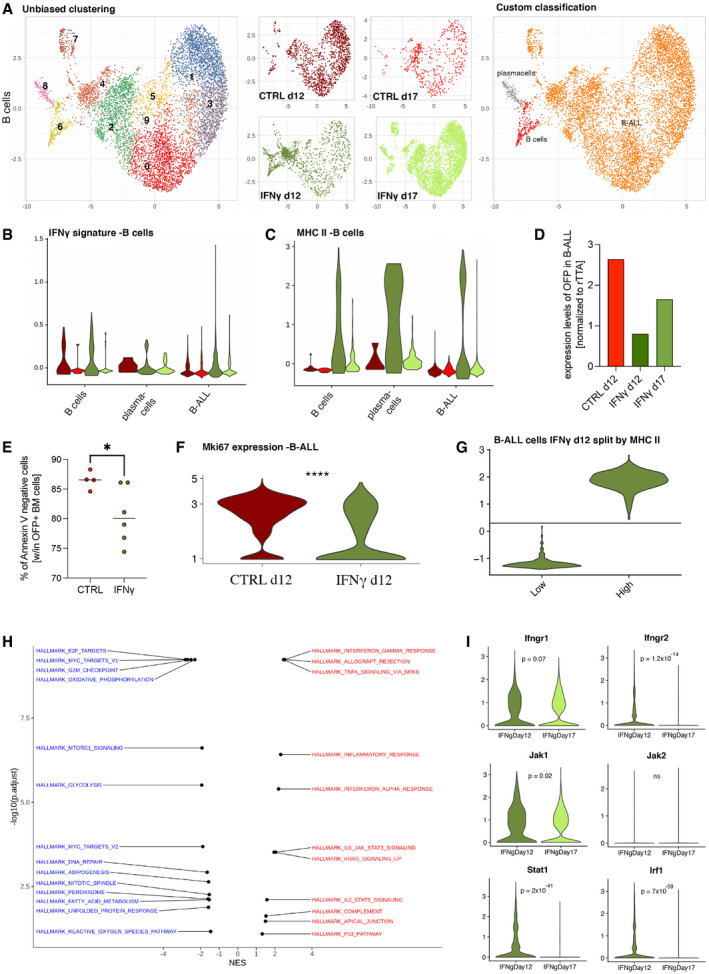
UMAP visualization of the B‐cell/B‐ALL compartment. From the left to the right panel, cells are colored according to unsupervised clustering (Louvain—resolution 0.6), experimental condition and marker‐based custom cell‐type classification, unequivocally identifying leukemic cells by the presence of the tTA transcript.
-
B, C
Violin plots show the distribution of IFN‐γ (B) and MHC II gene (C) signatures (module score value for each cell—see gene list details in methods) for each experimental condition, within each custom cell type. Wilcoxon rank‐sum test for IFN‐γ signature, condition IFN‐γ d12 vs. CTR d12: B‐ALL P = 2.68 × 10⁻¹⁹, B cells P = 0.5, plasma cells P = 0.78; Wilcoxon rank‐sum test for MHC II signature, condition IFN‐γ d12 vs. CTRL d12: B‐ALL P = 4.26 × 10−46, B cells P = 1 × 10⁻⁹, plasma cells P = 0.32.
-
D
Reduction of OFP expression in B‐ALL cells in the IFN‐γ‐treated vs. CTRL group (mean).
-
E
Viability of OFP+ B‐ALL cells before sorting for single‐cell RNA sequencing (mean, CTRL = 4 mice, IFN‐γ = 6 mice; *P = 0.0333, Mann–Whitney test).
-
F
Expression of Mki67 transcripts in B‐ALL cells from CTRL d12 and IFN‐γ d12 conditions, extracted from the scRNAseq dataset (****P ≤ 0.0001, Welch's test).
-
G, H
(G) IFN‐γ d12 B‐ALL cells were split according to MHC II gene signature values and compared for gene expression profile, in order to identify significantly enriched terms (within the hallmark gene set MsigDB collection) by using the GSEA approach (H). On the left, hallmark terms downregulated (negative NES—blue labels) in the MHC II high leukemia cell population are shown, whereas the right shows upregulated hallmark terms (positive NES—red labels) in the MHC II high leukemia cell population, as compared to the MHC II low counterpart.
-
I
Loss of IFN‐γ response over time in B‐ALL cells from the IFN‐γ group, potentially facilitated by reduced expression of Ifngr1, Ifngr2, Jak1, Stat1‐ and Irf1 (data extracted from the scRNAseq dataset statistical analysis by two‐way ANOVA).