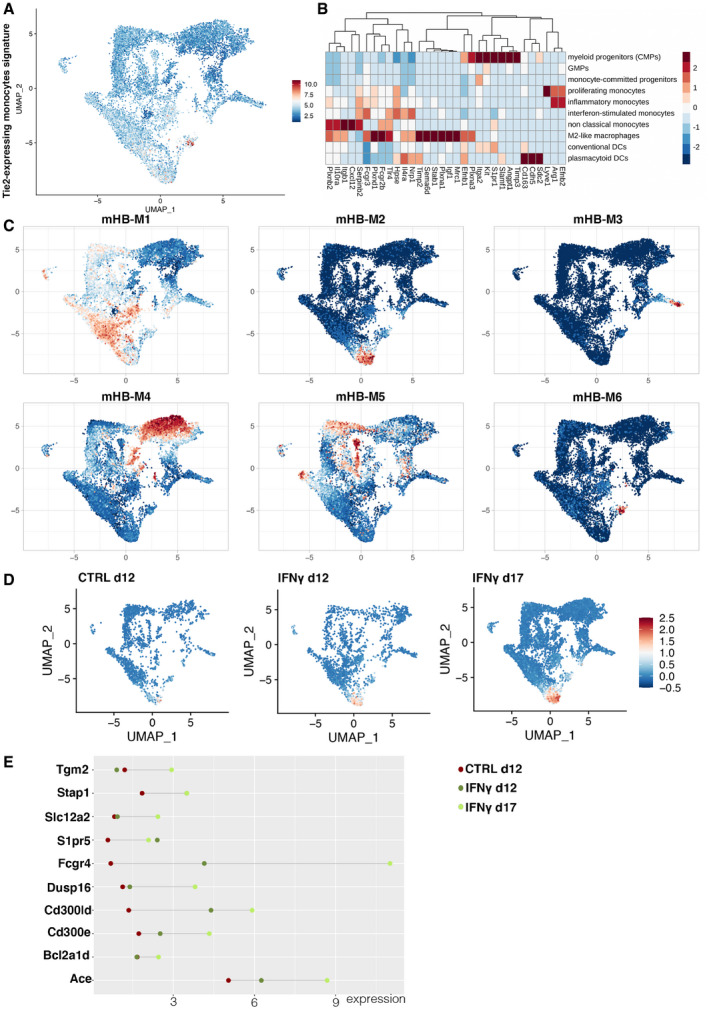
Figure EV5. Identification of Tie2‐expressing monocytes and non‐classical monocytes by scRNAseq analysis.

- UMAP highlighting cells expressing the signature of TEMs, based on the transcriptional signature published by Pucci et al (2009).
- Heatmap showing the expression of the genes from the TEM signature within the different myeloid populations defined by our custom signature (see Fig 3C).
- Mapping of the myeloid cell signatures identified by Witkowski et al (2020) onto the myeloid compartment of our leukemic mice. Note that the pro‐leukemic mHB‐M2 cluster colocalizes with our subset of non‐classical monocytes.
- Representation of the pro‐leukemic mHB‐M2 cluster across the different experimental conditions. Note that this cluster becomes more represented in the IFN‐γ group on day 17.
- Differential expression of mHB‐M2 marker genes in the myeloid cells of our treated animals, according to experimental group.
