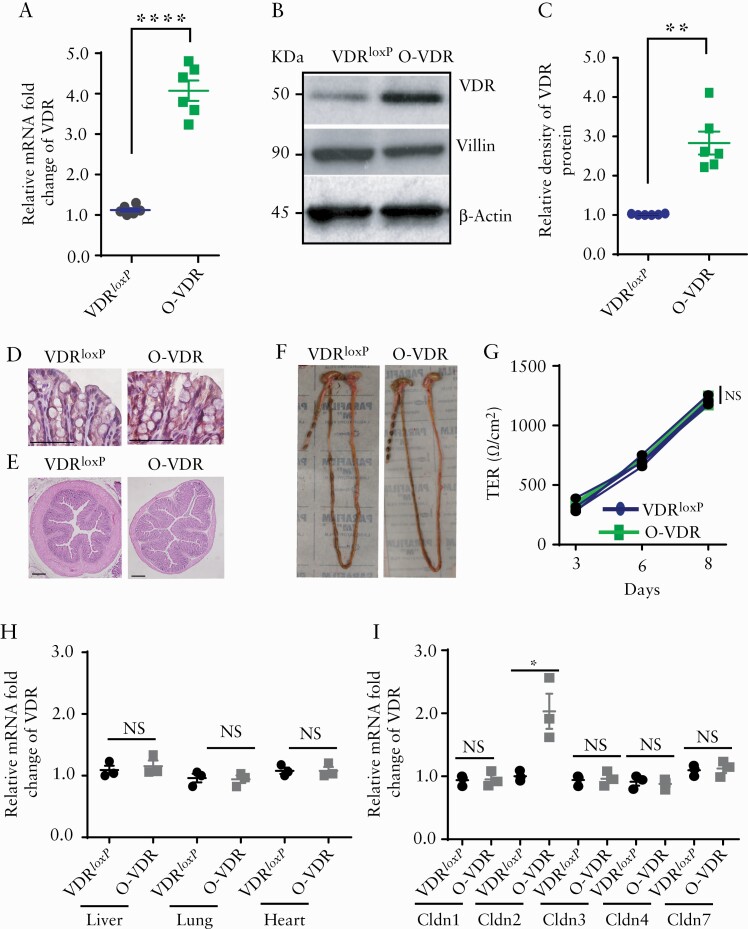
Figure 2.
O-VDR mouse model showed intestinal VDR overexpression. An increase in VDR expression in the O-VDR mouse colon was indicated by [A] mRNA, [B] western blot images, and [C] densitometry quantification of the blots. [D] IHC staining with anti-VDR antibody indicated augmented VDR expression in O-VDR mouse colonic epithelium. [E] O-VDR mice exhibited normal colon histopathology. [F] Morphology and normal colon length. [G] TEER of mouse colonoid-derived monolayers remained unchanged between the O-VDR and VDRloxP groups. [H] mRNA expression of VDR in the liver, lung, and heart remained unaltered in OVDR mice as compared with VDRloxP. [I] Increased mRNA expression of claudin-2 mRNA in OVDR mouse colon was detected; however, expression of Claudin- 1, 3, 4, and 7 did not change in OVDR mice as compared with VDRloxP mice. In each figure, values for VDRloxP are indicated by blue colour and for O-VDR are indicated by green colour. n = 3 to 6 mice per group. Data were analysed by unpaired t test for Figure 2A, C, H, and I and two-way ANOVA for 2G. NS = not significant, * p < 0.05, **p ≤ 0.01, and ***p ≤ 0.001. VDR, vitamin D receptor; IHC, immunohistochemical; TEER, transepithelial electrical resistance; ANOVA, analysis of variance.

