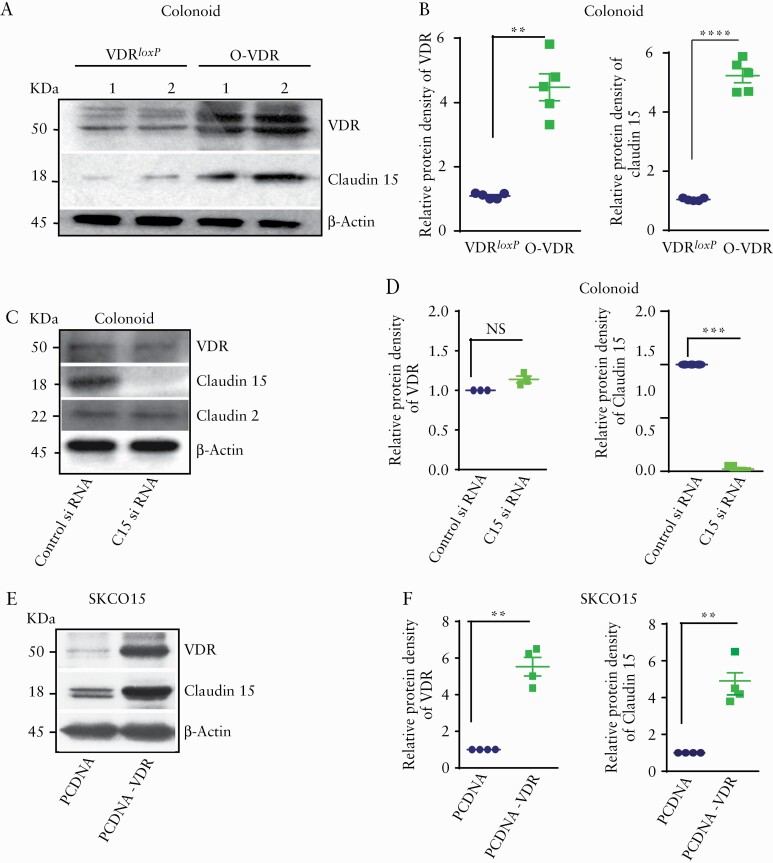
Figure 6.
VDR regulates Claudin-15 expression in vitro. [A] Western blot image shows higher VDR and Claudin-15 expression in mouse colonoids. [B] Densitometric quantification of the western blots. [C] Protein expression after Claudin-15 siRNA treatment in mouse colonoids. [D] Densitometric quantification of the western blots after silencing of Claudin-15 by siRNA. [E] Western blot images showing increased VDR and Claudin-15 expression in SKCO15 cells following transfection with hVDR. [F] Quantification of the blot. In each figure, values for the control group are indicated by blue colour and for the experimental group are indicated by green colour; n = 3–6 for each group. Data were analysed by unpaired t test or ANOVA, NS p > 0.05, *p ≤ 0.05, **p ≤ 0.01, ***p ≤ 0.001, ****p ≤ 0.0001. VDR, vitamin D receptor; ANOVA, analysis of variance; NS, non-significant.

