Figure 1.
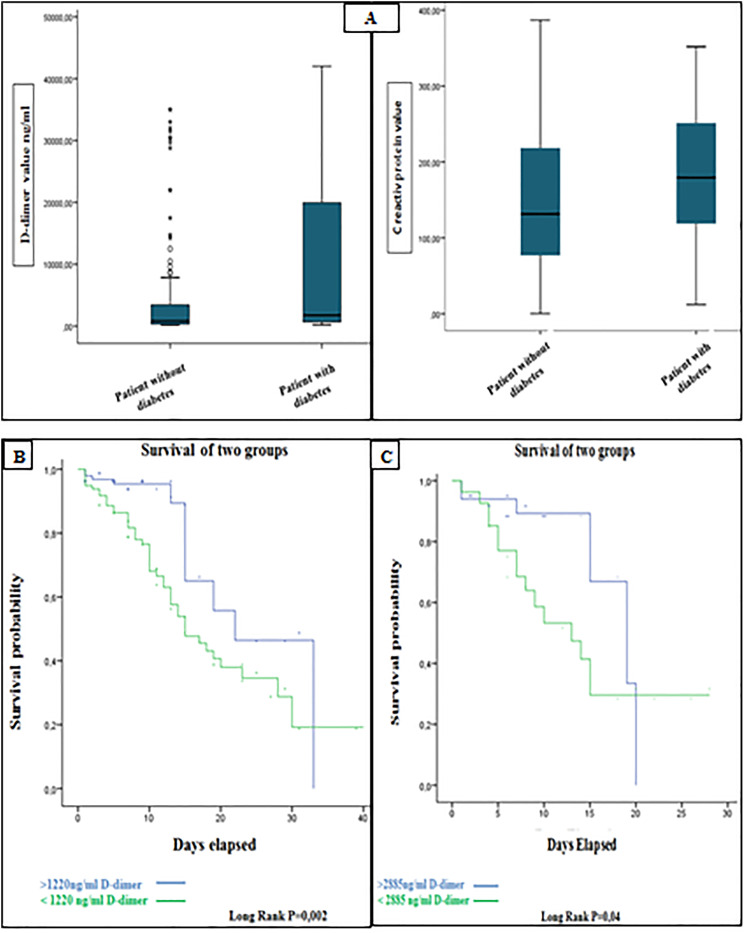
(A) Box and whisker plots of serum D-dimer and CRP peak concentrations measured in the patient with diabetes and patients without diabetes with COVID-19. (B) Survival curve for D-dimer levels in all patients with SARS-CoV-2. (C) Survival curve for D-dimer levels in diabetic patients with SARS-CoV-2.

