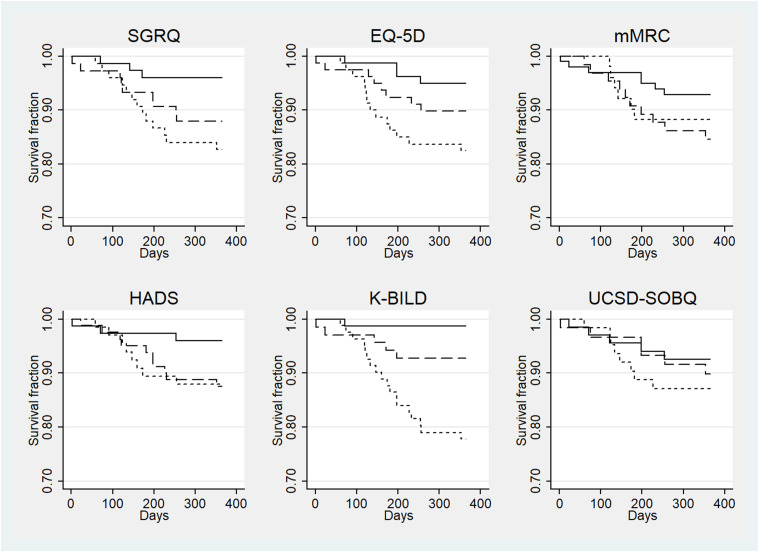
Figure 1.
Survival curves for patient related outcome measures. Kaplan–Meier curves for survival (1-year mortality) for (a) SGRQ: St George’s Respiratory Questionnaire, (b) EQ5D: 5-Level Euroqol 5-dimension, (c) mMRC: modified Medical Research Council dyspnoea scale, (d) HADS: Hospital Anxiety and Depression Score, (e) K-BILD: King’s Brief Interstitial Lung Disease Questionnaire and (f) UCSD-SOBQ: University of California, San Diego shortness of breath questionnaire. Individuals were divided into three equal groups according to the baseline total score of each questionnaire: better, middle and worse health status. A comparison was made between tertile groups. Solid lines represent the better health status, dashed lines represent middle health status and dotted lines represent worse health status.

