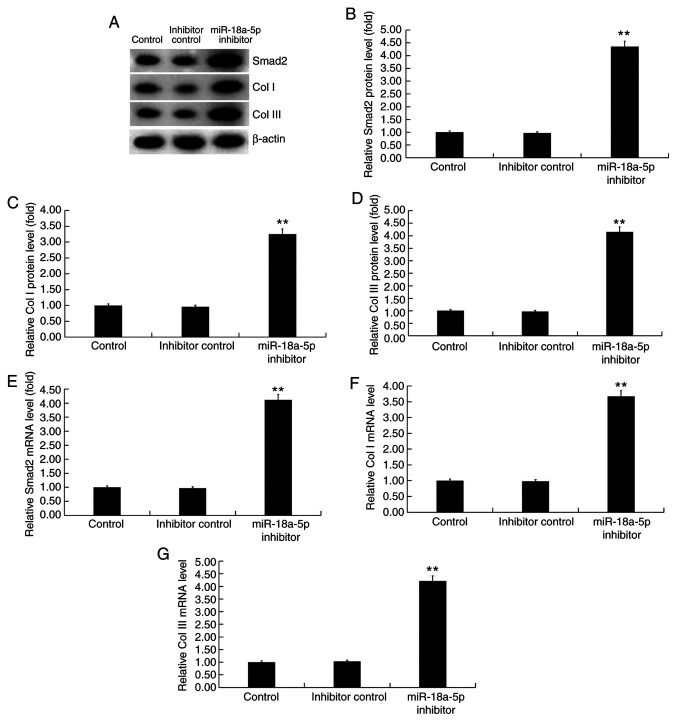
Figure 4.
Effect of miR-18a-5p inhibitor on Smad2, Col I and Col III expression levels in hHSFs. The hHSFs were transfected with inhibitor control or miR-18a-5p inhibitor for 48 h. (A) Western blot assay was used to measure the protein levels of Smad2, Col I and Col III in hHSFs. (B) Smad2, (C) Col I and (D) Col III relative protein levels in hHSFs were calculated and are presented as the fold of the control levels. (E) Smad2, (F) Col I and (G) Col III relative mRNA expression levels in hHSFs were measured by reverse transcription-quantitative polymerase chain reaction. Data are presented as the mean ± standard deviation. **P<0.01 vs. control group. miR, microRNA; hHSFs, human hypertrophic scar fibroblasts; Col, Collagen.

