FIGURE 2.

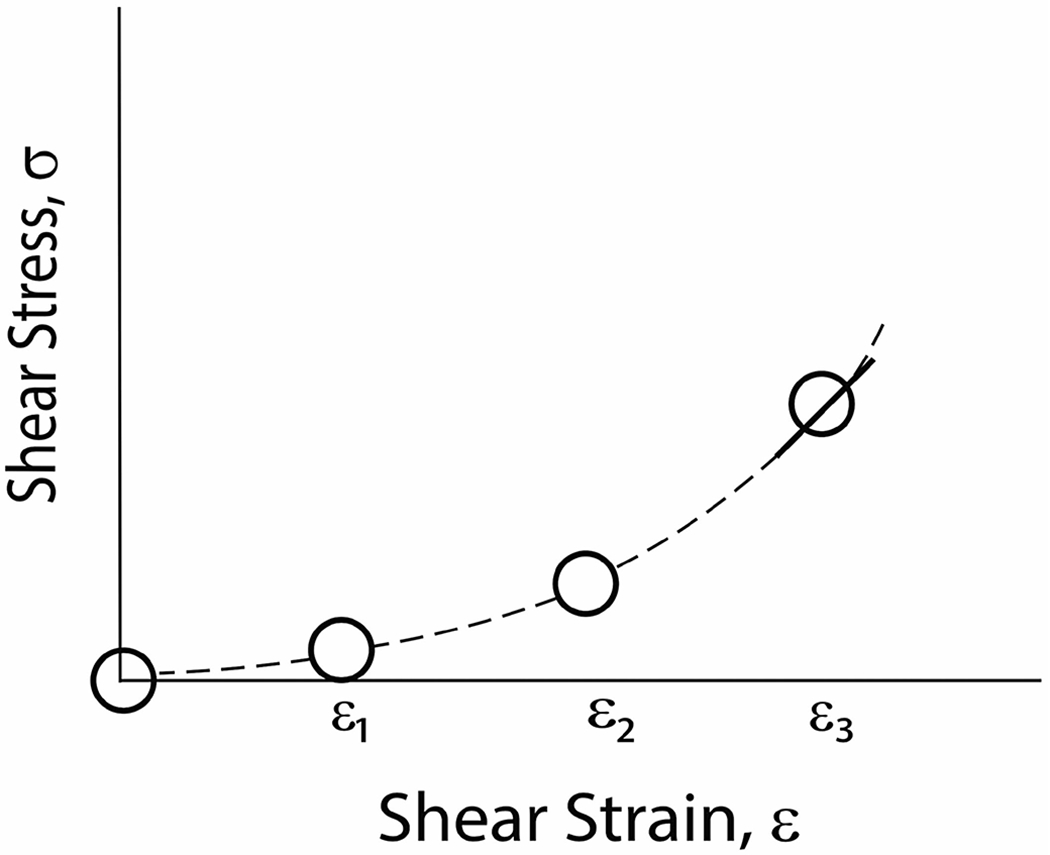
Schematic stress-strain relationship for soft tissue unloaded and at three different tissue-loading states. Magnetic resonance elastography measures the slope of this curve at a given point, as indicated by the tangent line at ε3

Schematic stress-strain relationship for soft tissue unloaded and at three different tissue-loading states. Magnetic resonance elastography measures the slope of this curve at a given point, as indicated by the tangent line at ε3