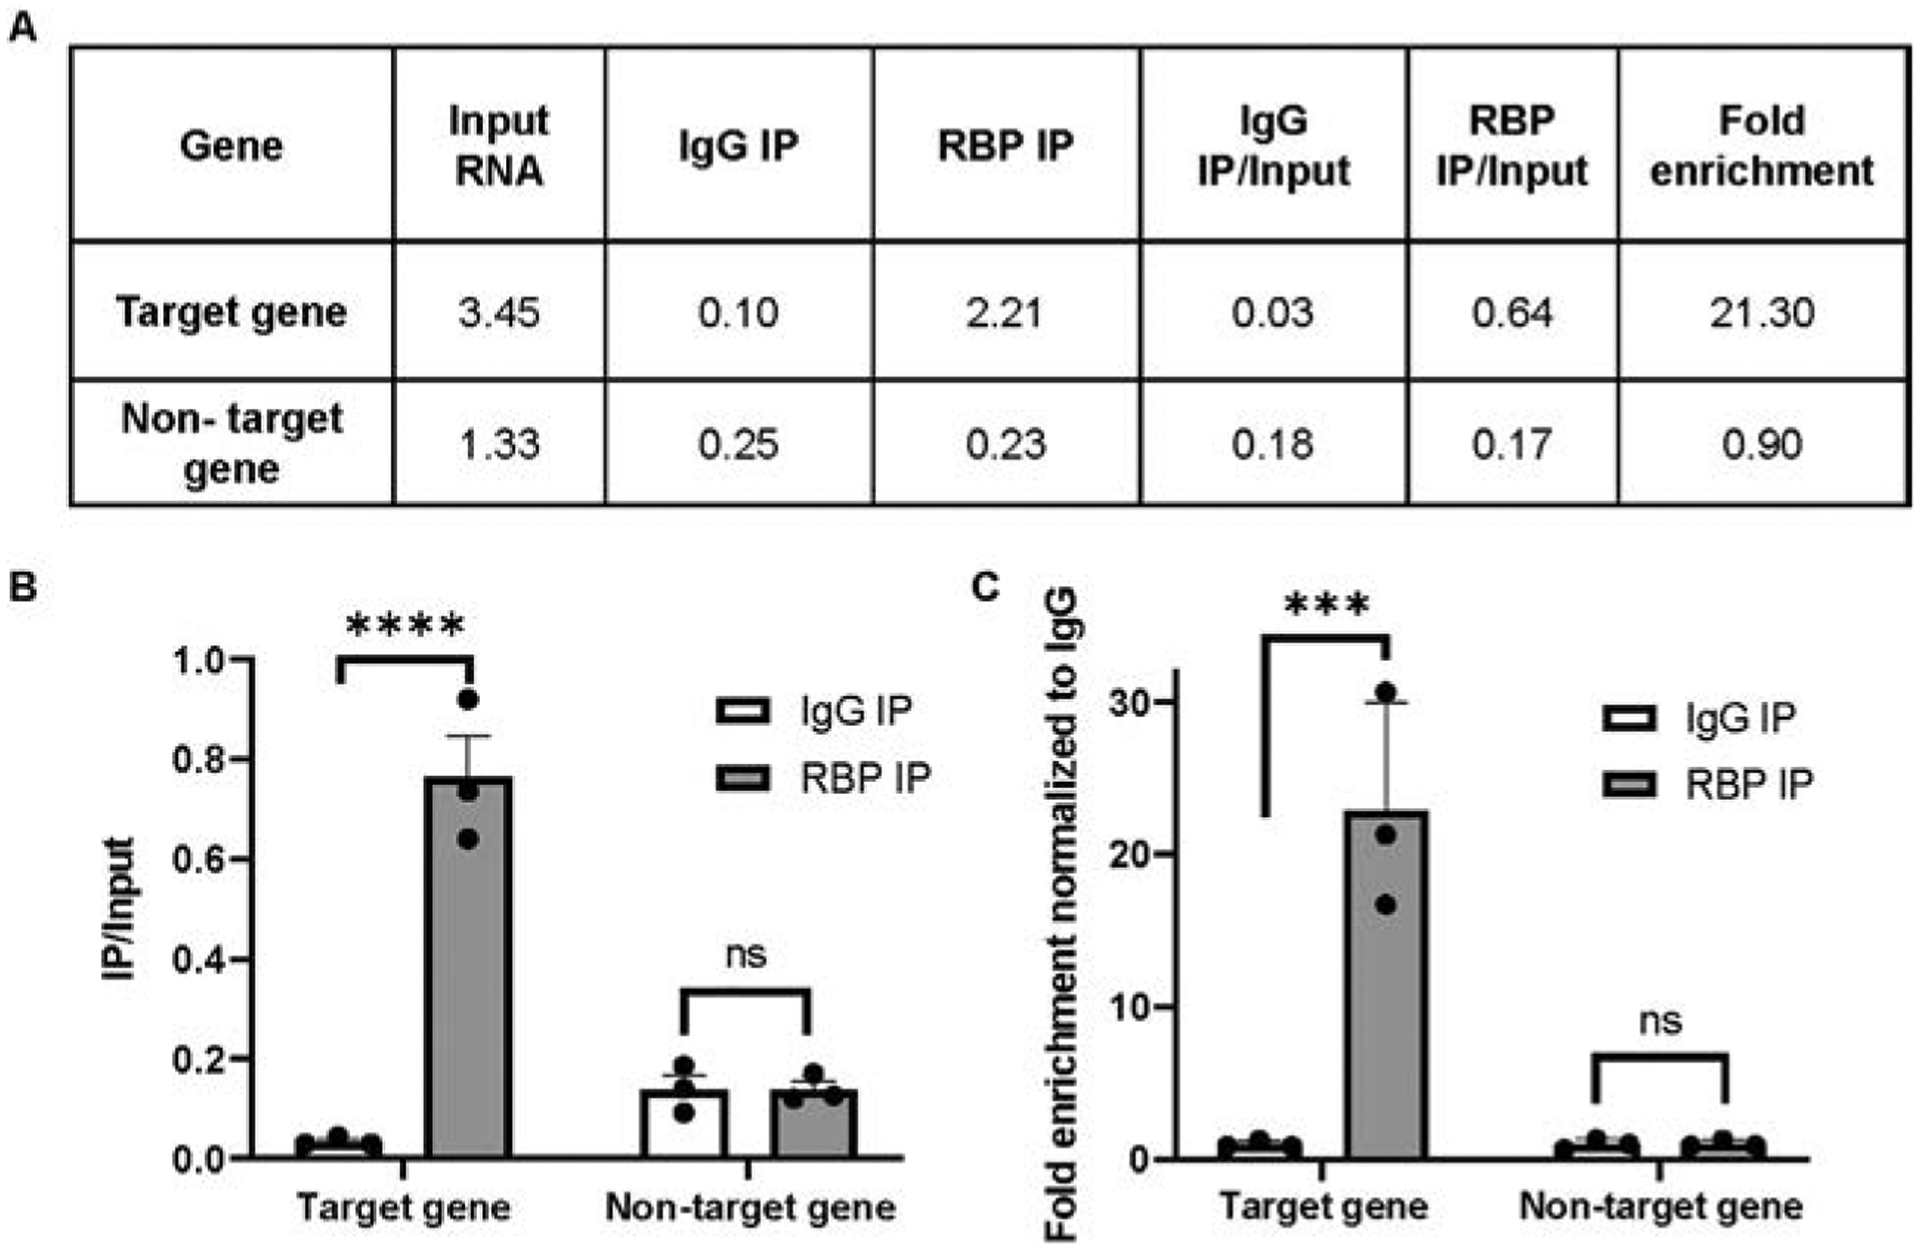
Fig. 2.

Representative RIP qRT-PCR results. (A) The table lists the amount of cDNA amplification detected by qRT-PCR in RNA samples for Input lysate as well the IgG and RBP immunoprecipitations. For each gene under study, the amount of RNA detected in the IP samples is normalized by the amount of corresponding gene in the input. (B) Bar graph represents the cDNA present in the RIPs divided by cDNA present in the input lysates for each gene. (C) The bar graph represents the fold enrichment of cDNA present in the RBP RIP divided by cDNA present in the input lysates normalized to the same ratio in the IgG control RIP. The mean of replicates is plotted with error bars representing standard error of the mean. Statistical significance was determined by two-way ANOVA, where **** represents P<0.0001.
