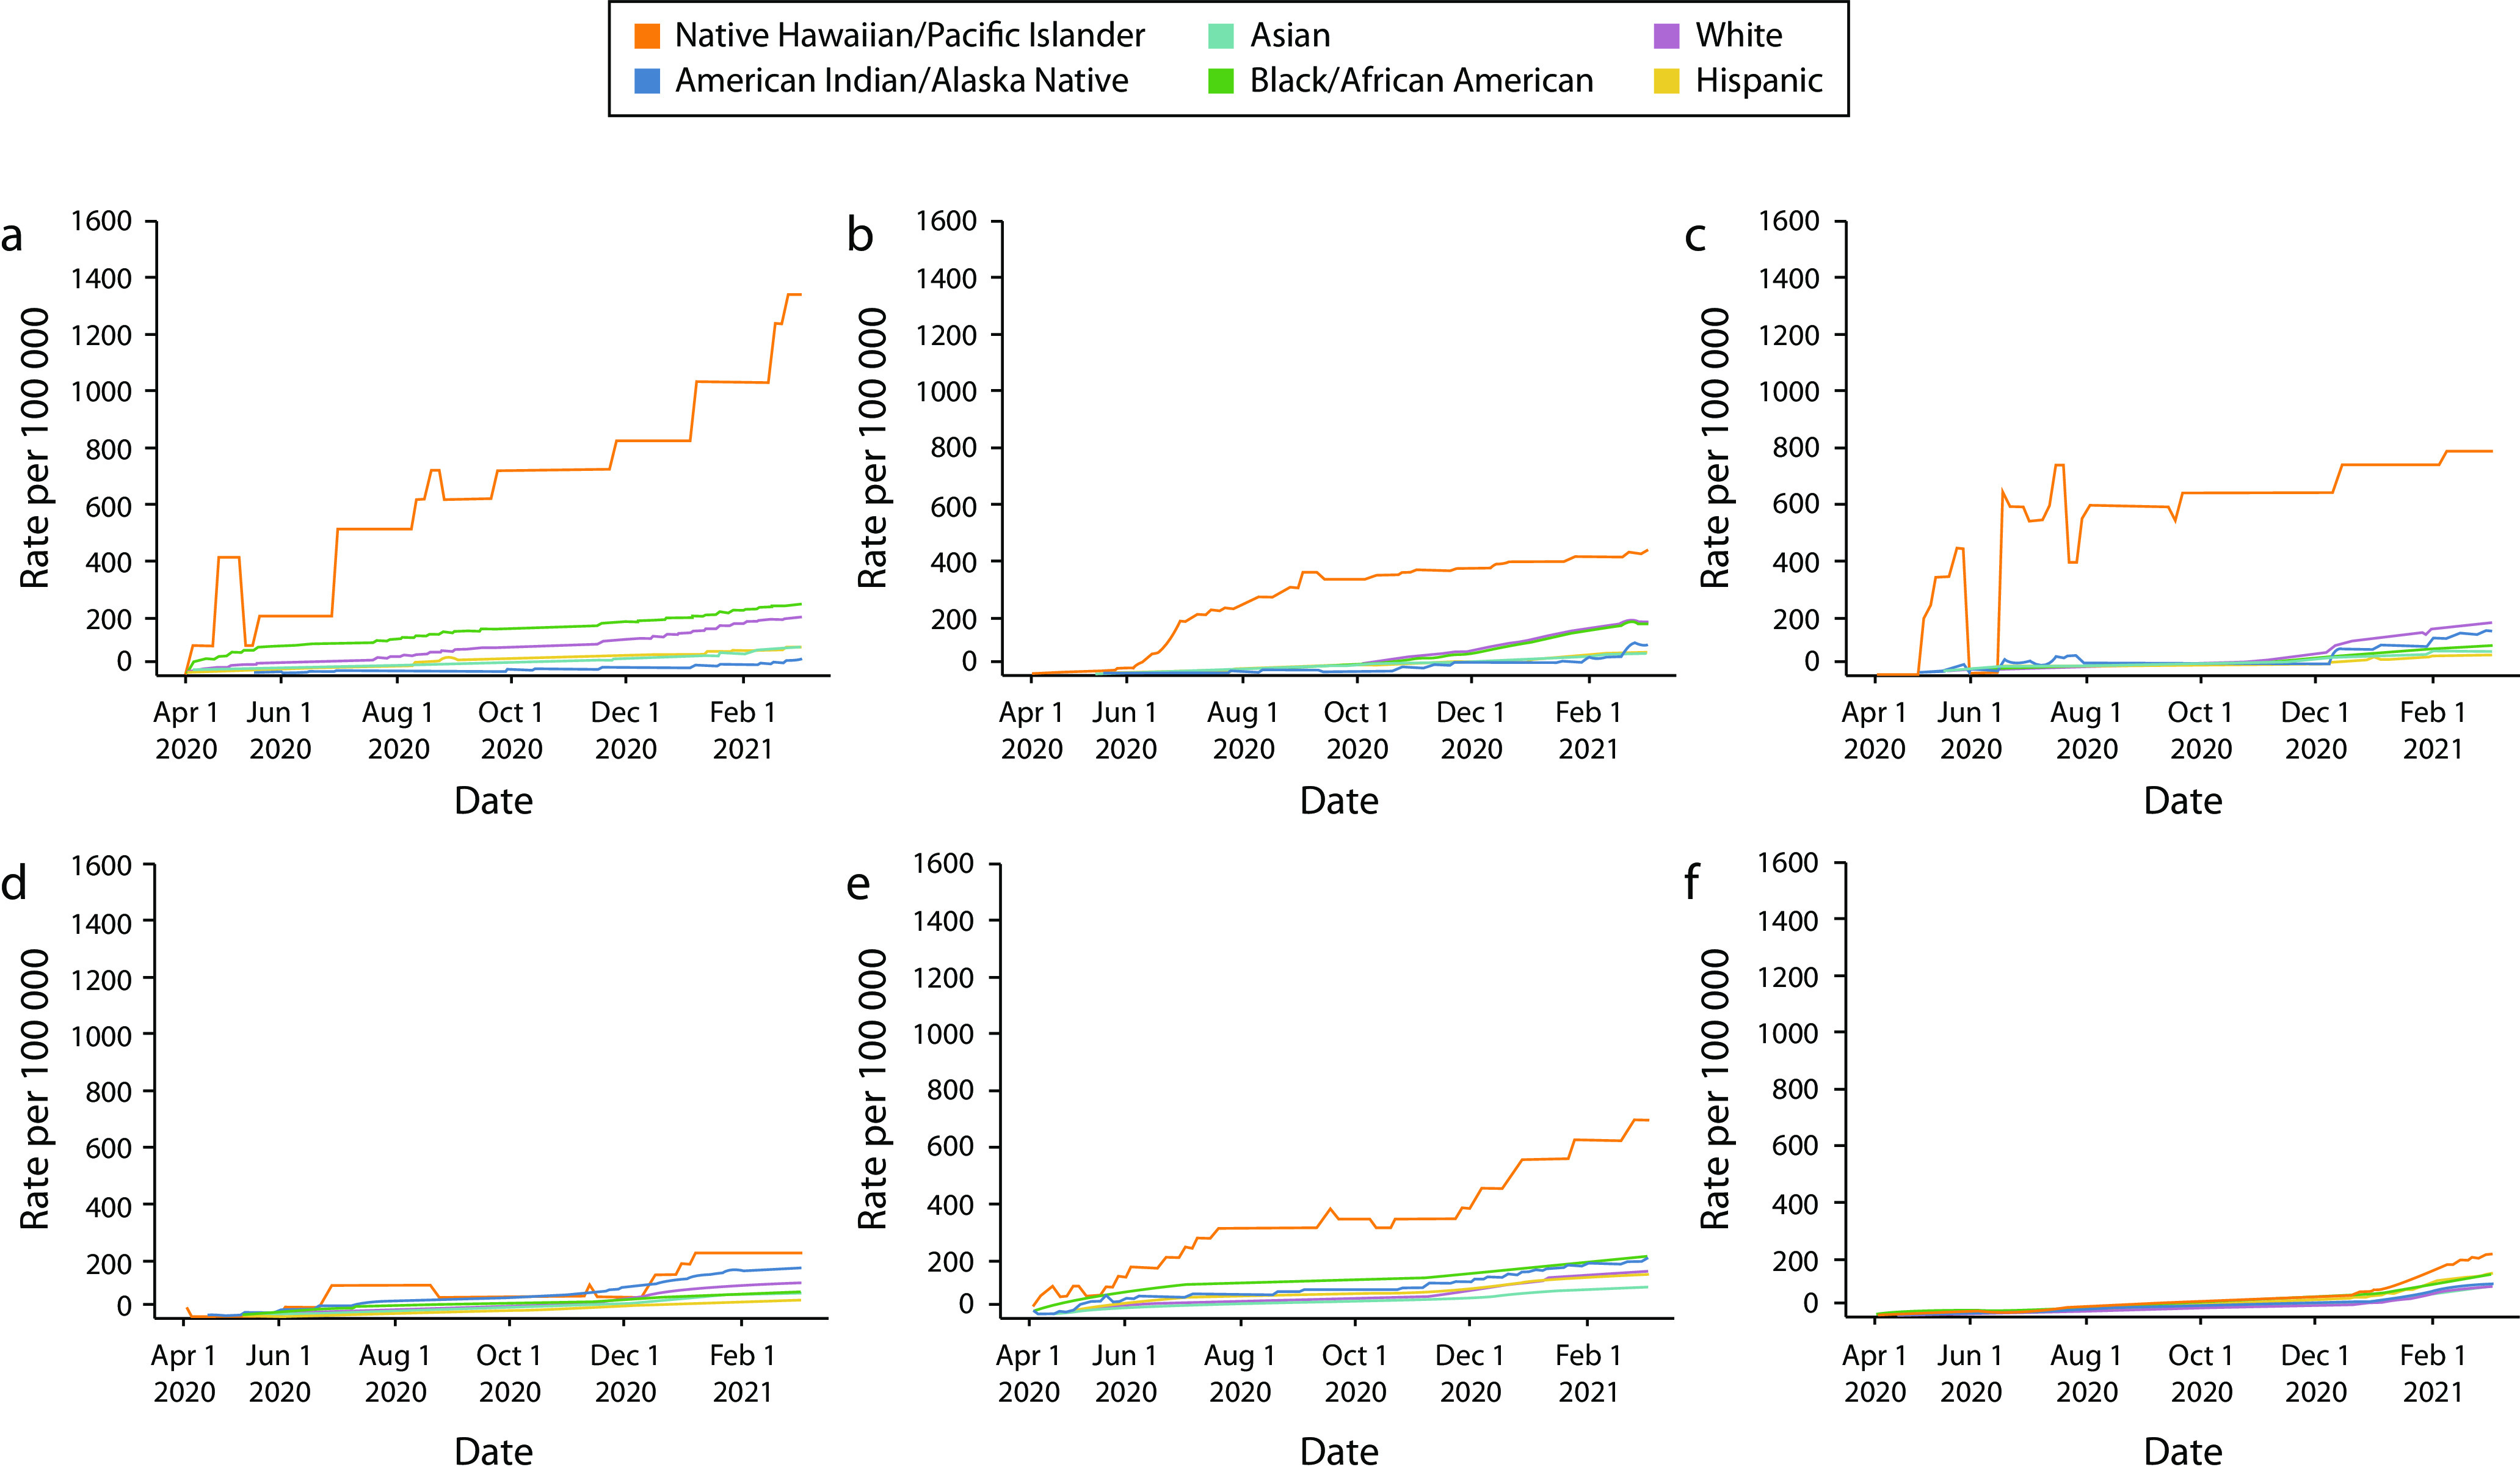
FIGURE 1.

State Racial and Ethnic Death Rates per 100 000 as of March 3, 2021 in (a) Louisiana, (b) Arkansas, (c) Iowa, (d) Minnesota, (e) Illinois, and (f) California
Source. COVID Racial Data Tracker. 7 Last accessed March 4, 2021; US Census Bureau, 5-year American Community Survey, Table DP05.
Note. The Native Hawaiians and Pacific Islanders COVID-19 Data Policy Lab updated the population denominators for calculating case and death rates to use the 2019 American Community Survey 1-year population estimates. The updated calculations continue to match the different definitions of the race and ethnicity states use in their COVID-19 reporting.
