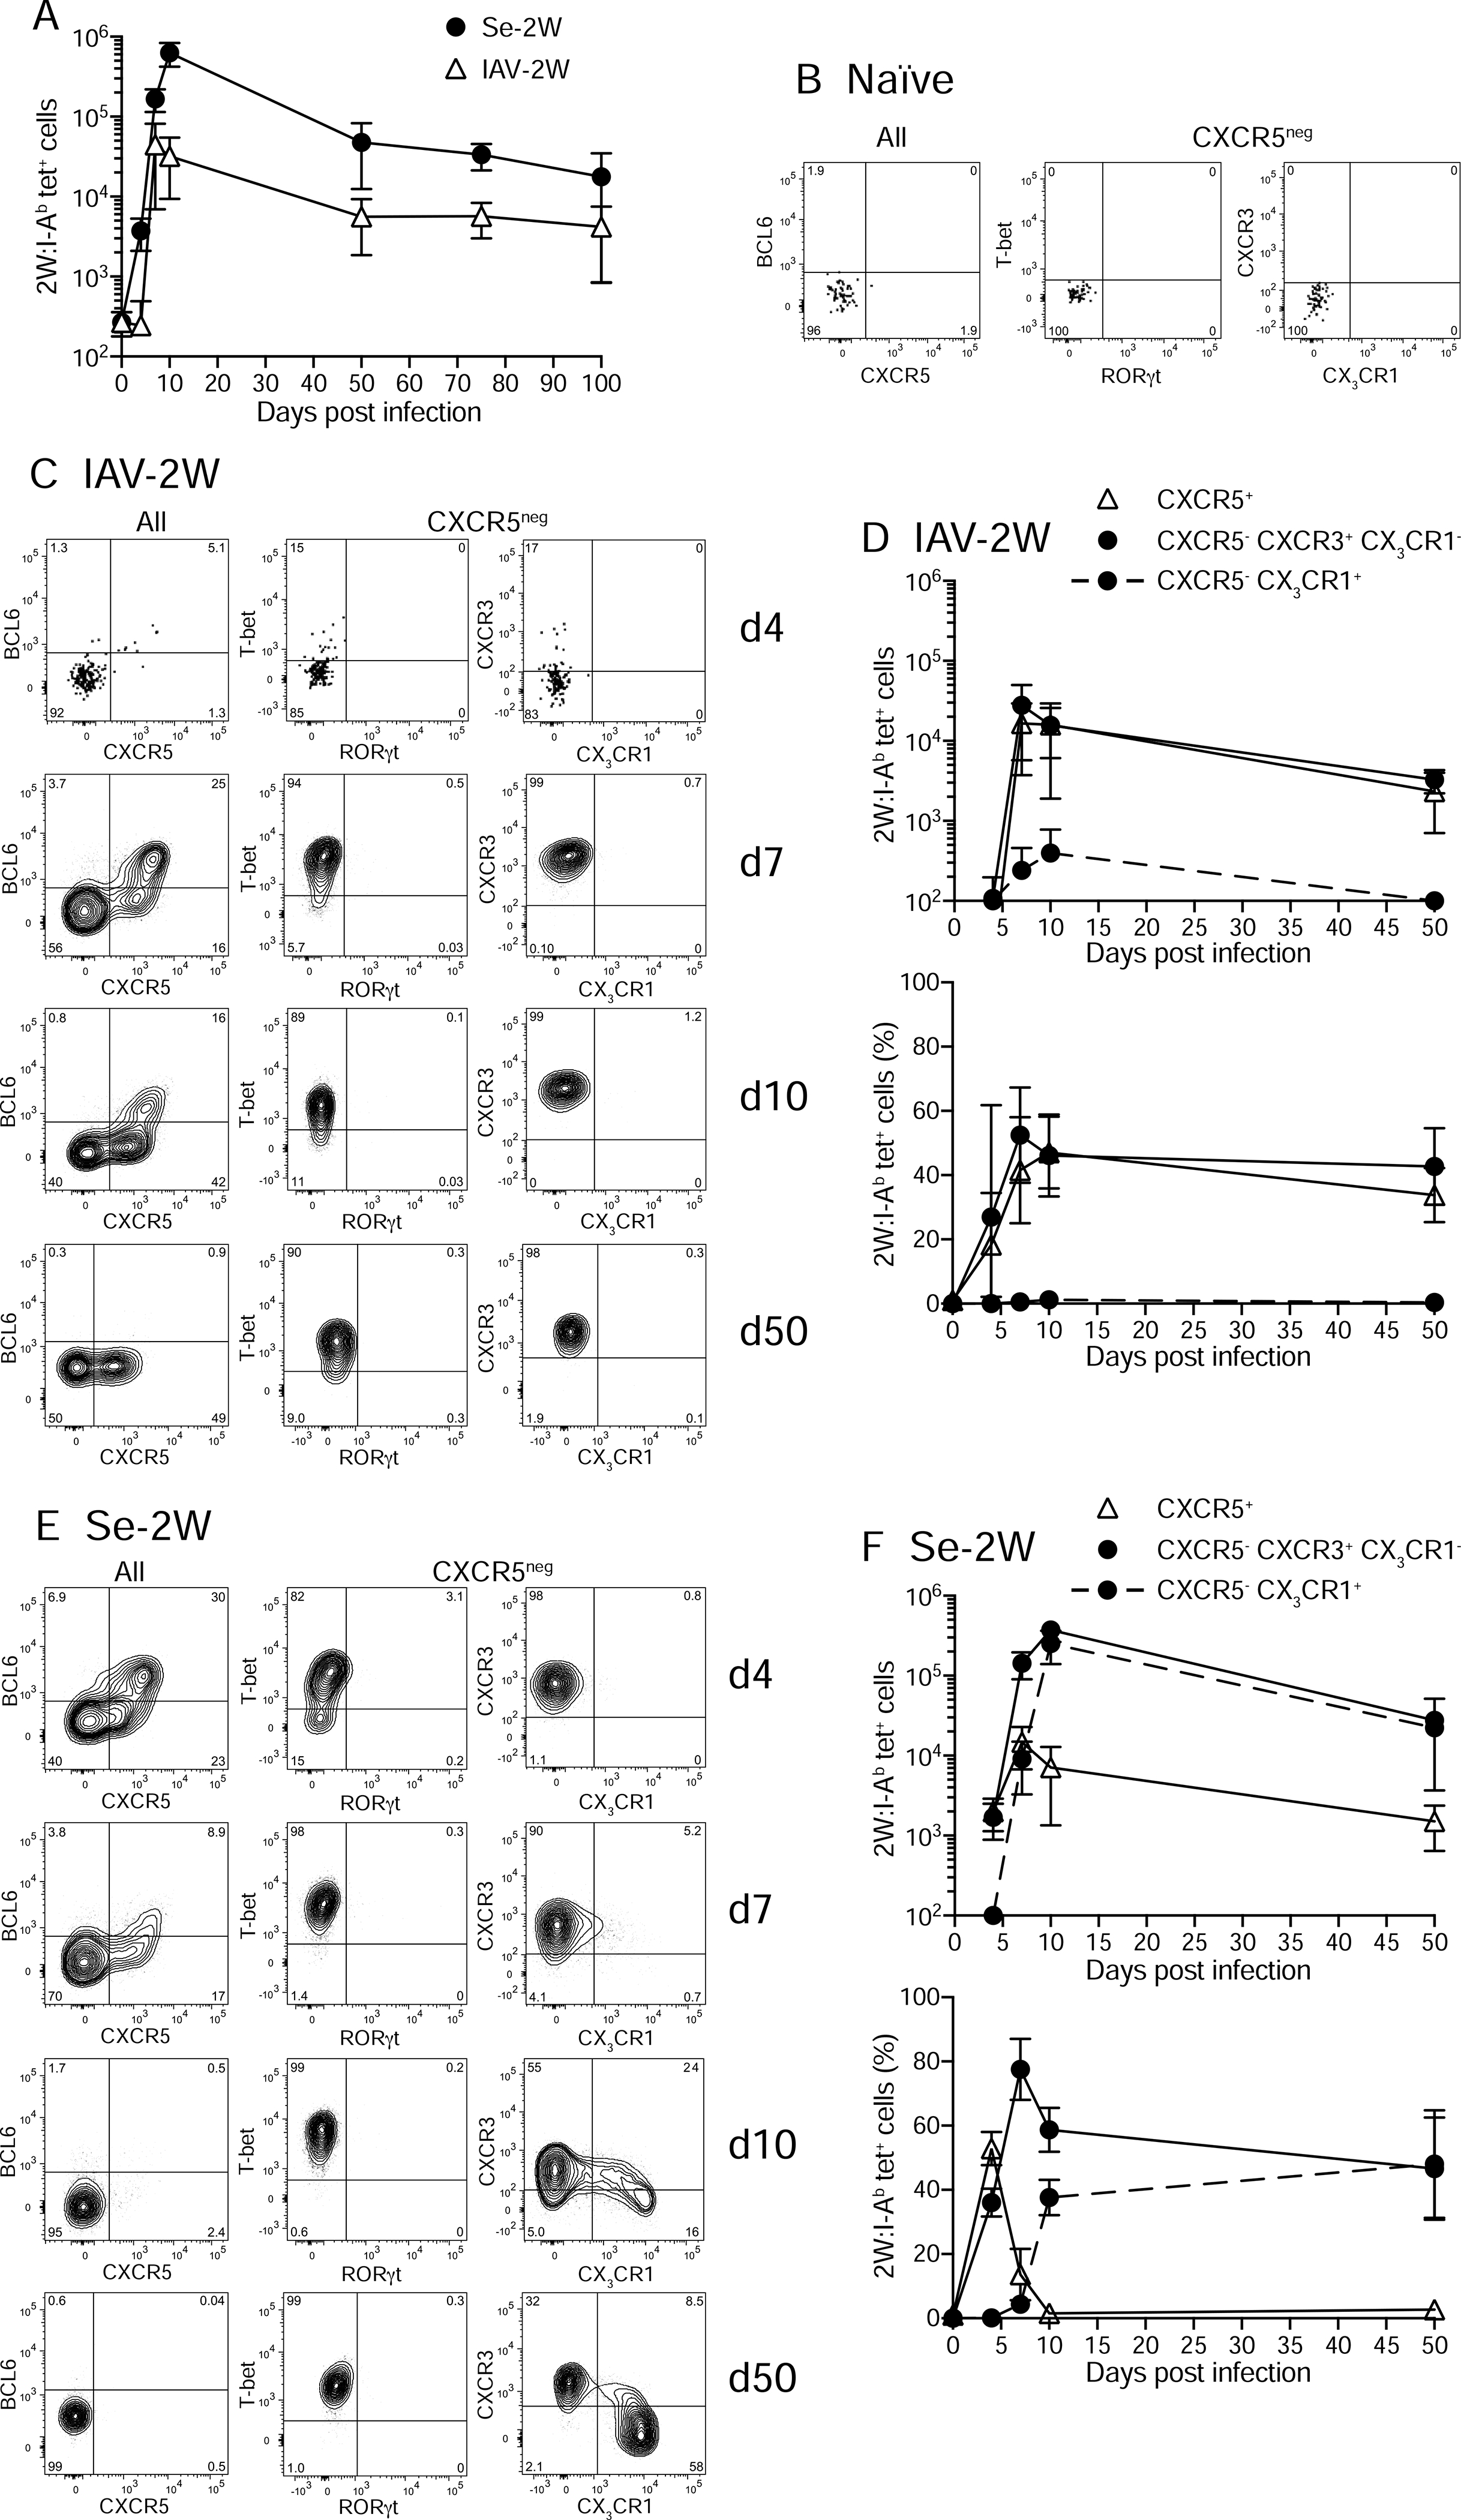
Fig. 1. Expansion and differentiation of naïve 2W:I-Ab-specific T cells after infection with IAV-2W or Se-2W.

(A) Mean numbers (± SD) of 2W:I-Ab tetramer-binding cells in the spleen and lymph nodes of B6 mice at the indicated times after infection. (B) Flow cytometry plots of the indicated molecules for 2W:I-Ab tetramer+ (left) or CXCR5− 2W:I-Ab tetramer+ cells (middle and right) from tetramer-enriched spleen and lymph node samples from an unimmunized B6 mouse. (C) Flow cytometry plots of the indicated molecules for 2W:I-Ab tetramer+ (left) or CXCR5− 2W:I-Ab tetramer+ cells (middle and right) from tetramer-enriched spleen and lymph node samples of B6 mice four, seven, 10, or 50 days after infection with IAV-2W. (D) Mean numbers (± SD) (top) or percentages (bottom) of 2W:I-Ab tetramer-binding cells with the indicated phenotypes from individual mice at the indicated times after IAV-2W infection. (E) Flow cytometry plots of the indicated molecules for 2W:I-Ab tetramer+ (left) or CXCR5− 2W:I-Ab tetramer+ cells (middle and right) from tetramer-enriched spleen and lymph node samples of B6 mice four, seven, 10, or 50 days after infection with Se-2W. (F) Mean numbers (± SD) (top) or percentages (bottom) of 2W:I-Ab tetramer-binding cells with the indicated phenotypes from individual mice at the indicated times after Se-2W infection. A-F, n ≥ three mice per group/time point. See also Fig. S1 and S2.
