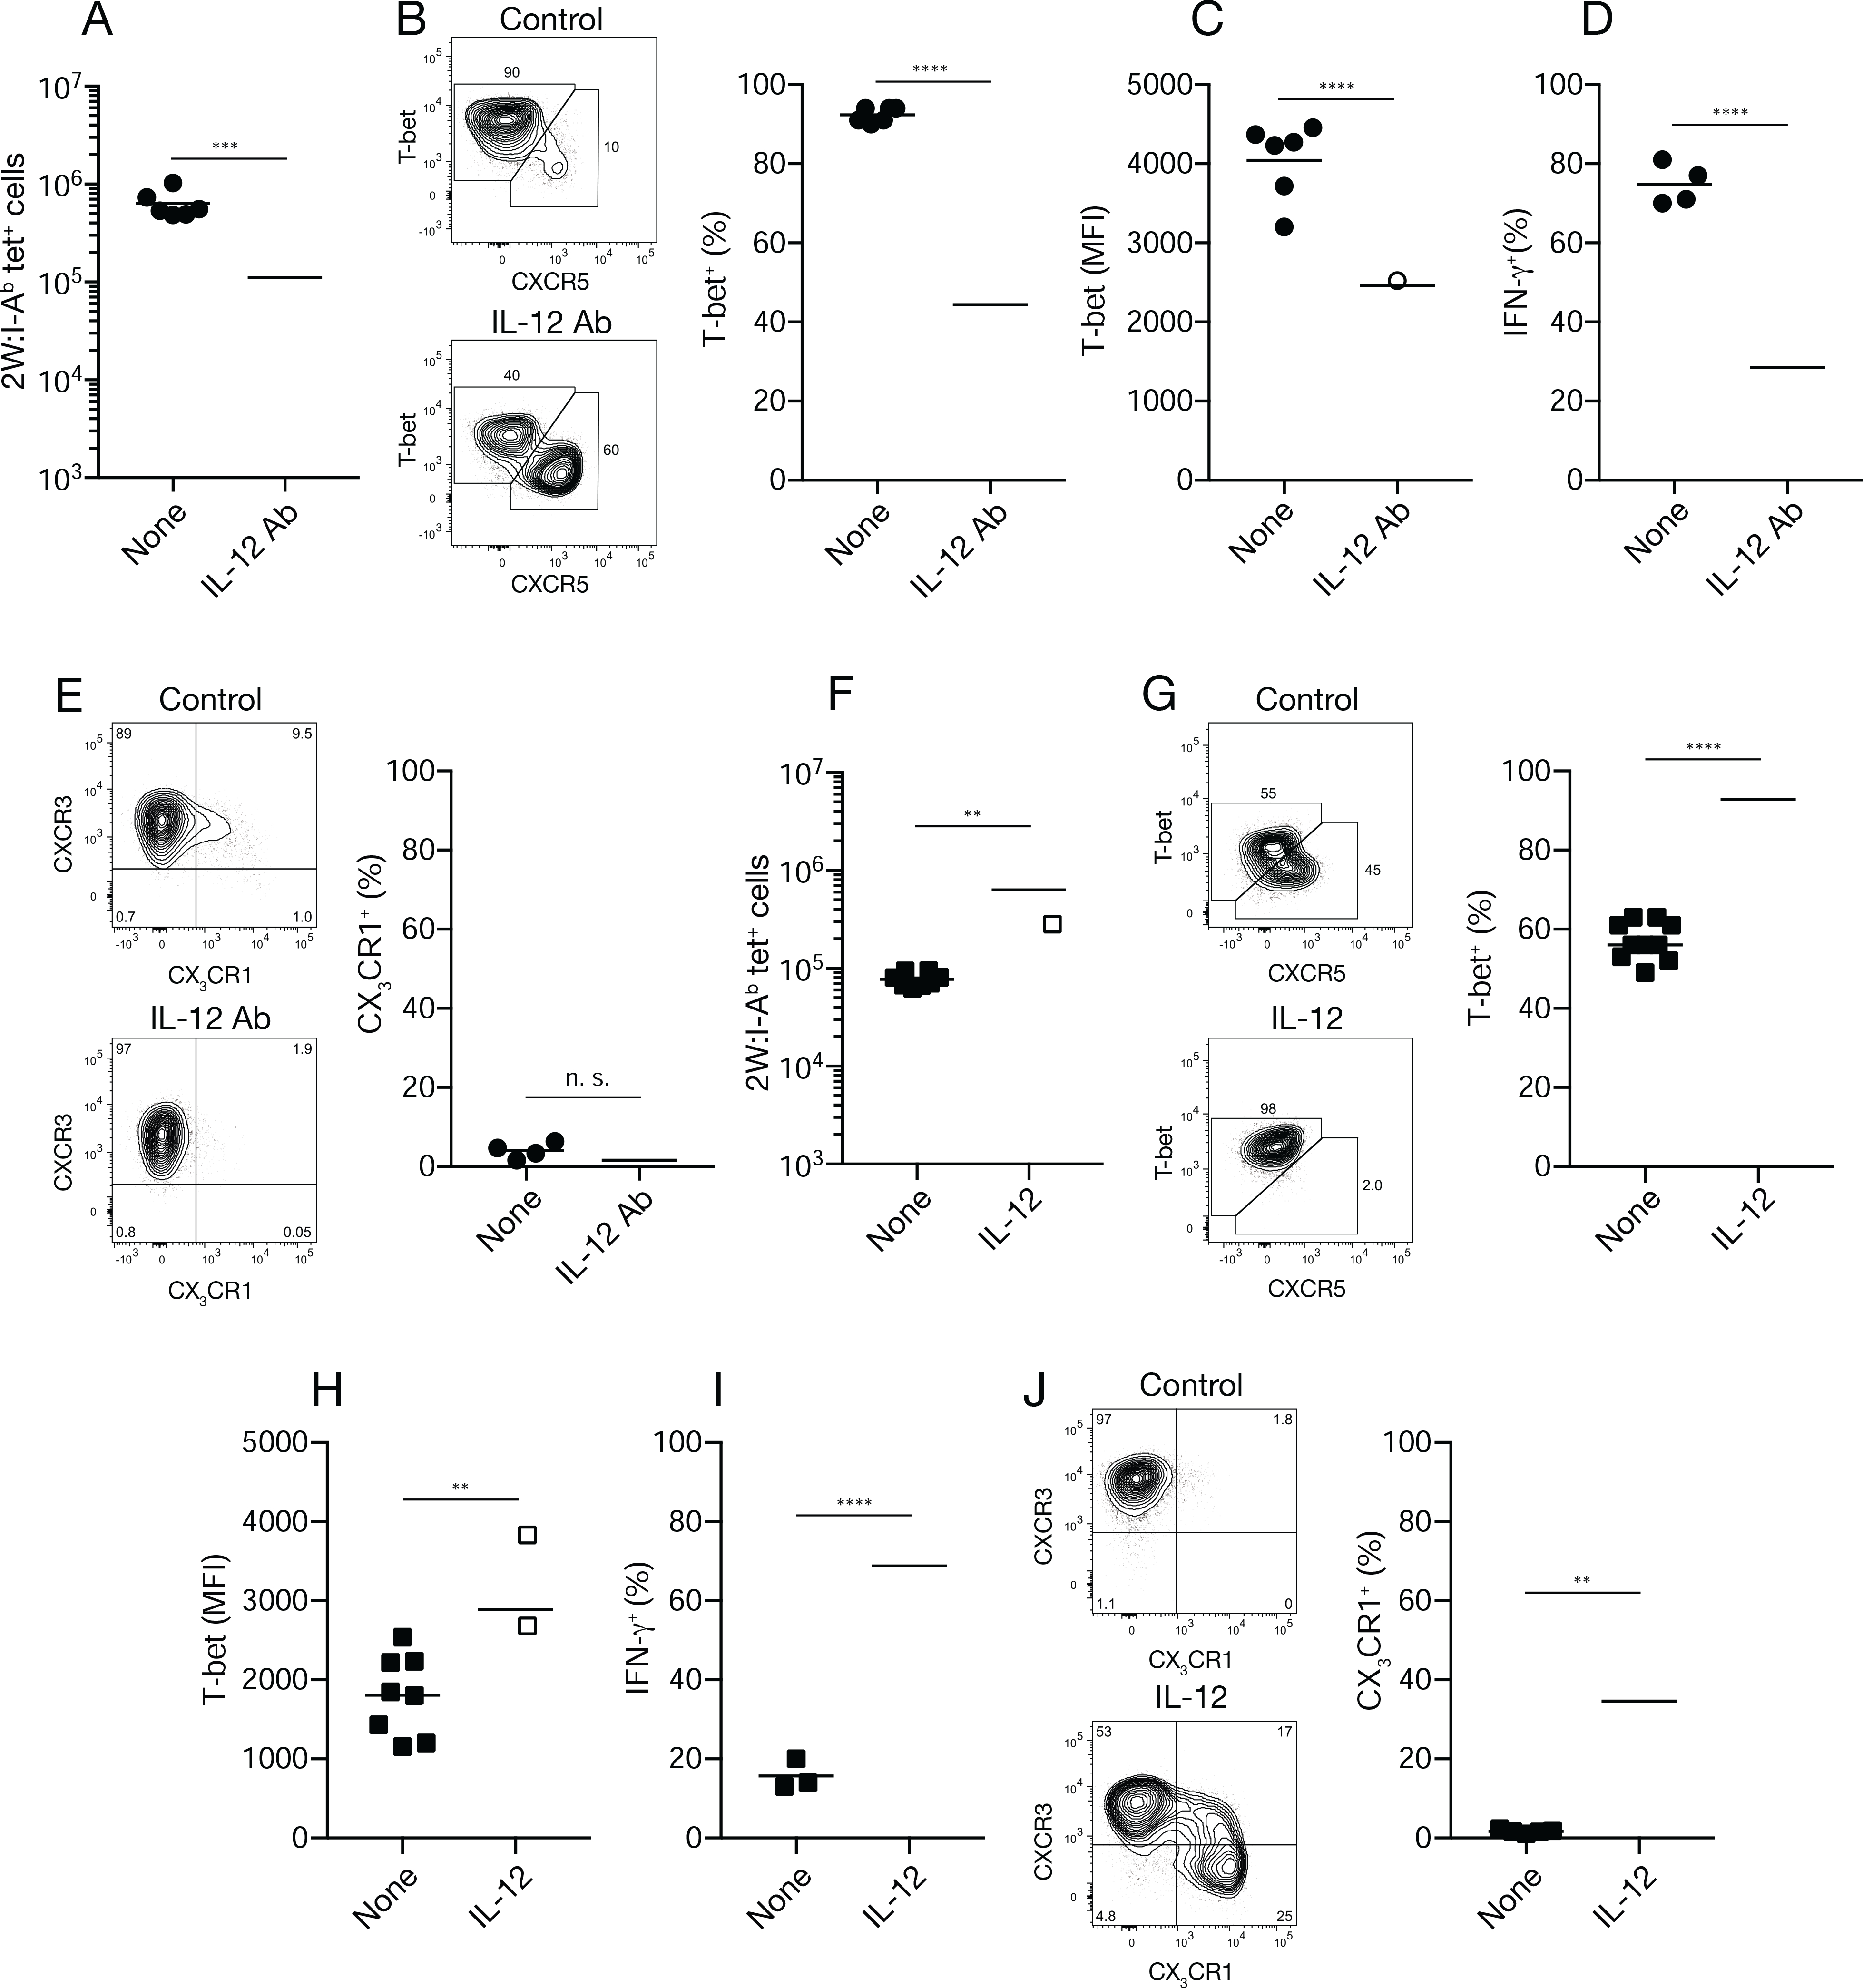
Fig. 5. Effects of IL-12 neutralization or addition on epitope-specific CD4+ T cells during infections.

(A) Number of 2W:I-Ab tetramer-binding cells from individual Se-2W-infected mice (n ≥ six from two independent experiments) given nothing or IL-12 antibody (Ab) on days two and four of infection and analyzed on day seven. (B) Flow cytometry plots of 2W:I-Ab tetramer-binding cells from Se-2W-infected mice given nothing (top) or IL-12 antibody (bottom) on days two and four of infection and analyzed on day seven, with a scatter plot of the percent of T-bet+ cells among 2W:I-Ab tetramer-binding cells. (C, D) Mean fluorescence intensity of T-bet+ cells (C) or IFN-γ+ cells among T-bet+ 2W:I-Ab tetramer-binding cells two hours after peptide challenge (D) from individual mice (n ≥ four from two independent experiments) of the indicated treatment groups. (E) Flow cytometry plots of 2W:I-Ab tetramer-binding cells from Se-2W-infected mice given nothing (top) or IL-12 antibody (bottom) on days two and four of infection and analyzed on day seven, with a scatter plot of the percent of CX3CR1+ cells among 2W:I-Ab tetramer-binding cells from the two groups. (F) Number of 2W:I-Ab tetramer-binding cells from individual IAV-2W-infected mice (n = nine from three independent experiments) given nothing or recombinant IL-12 on days three-six of infection and analyzed on day 10. (G) Flow cytometry plots of 2W:I-Ab tetramer-binding cells from IAV-2W-infected mice given nothing (top) or recombinant IL-12 (bottom) on days three-six of infection and analyzed on day 10, with a scatter plot of the percent T-bet+ cells among 2W:I-Ab tetramer-binding cells. (H, I) Mean fluorescence intensity of T-bet+ cells (H) or IFN-γ+ cells among T-bet+ 2W:I-Ab tetramer-binding cells two hours after peptide challenge (I) from individual mice (n ≥ three from two independent experiments) of the indicated treatment groups. (J) Flow cytometry plots of T-bet+ 2W:I-Ab tetramer-binding cells from Se-2W-infected mice given nothing (top) or recombinant IL-12 (bottom) on days three-six of infection and analyzed on day 10, with a scatter plot of the percent of CX3CR1+ cells among T-bet+ 2W:I-Ab tetramer-binding cells. Values were compared using an unpaired Student’s t-test. **p < 0.01; ***p < 0.001; ****p < 0.0001; n.s., not significant. Mean values on scatter plots are indicated with a horizontal bar.
