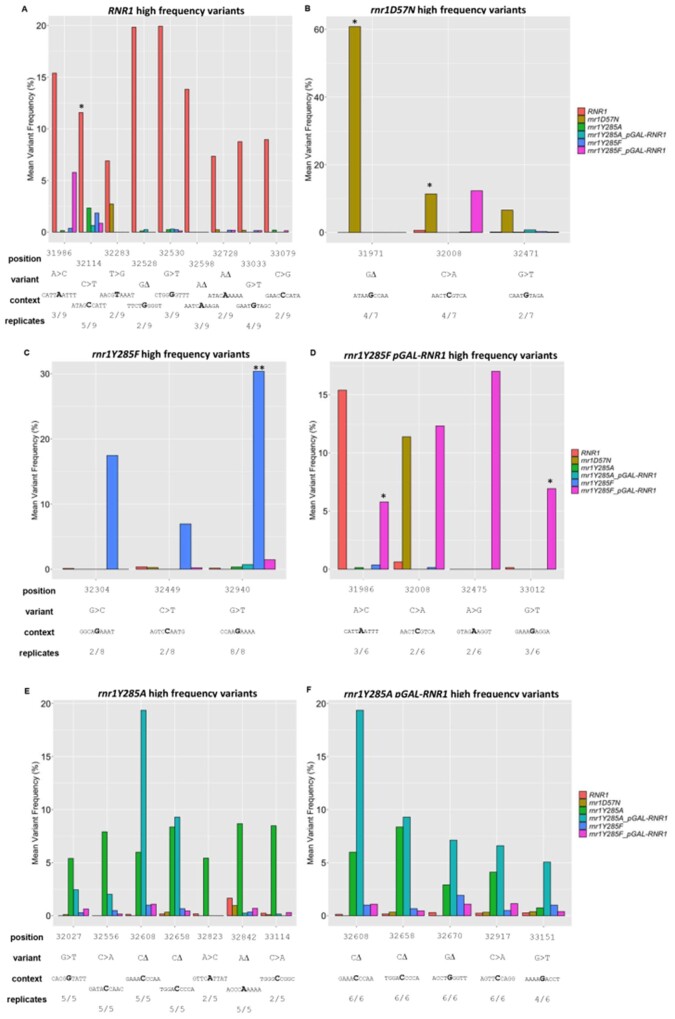
Figure 6.
High-frequency variants occur systematically in rnr1Y285F/A genotypes. Unique variants with an average variant frequency >5% for (A) wildtype, (B) rnr1D57N, (C) rnr1Y285F-pGAL RNR1, (D) rnr1Y285F, (E) rnr1Y285A-pGAL-RNR1, (F) rnr1Y285A. For comparison, the average frequency of each variant in other genotypes is also plotted. Below each plot, the fraction of biological replicates in which the variant occurred is observed and the surrounding sequence context are indicated. *, unique variant occurred in ≥50% of biological replicates for the genotype analyzed; **, unique variant occurred in 100% of biological replicates for the genotype analyzed.
Note: Figure Replacement Requested.

