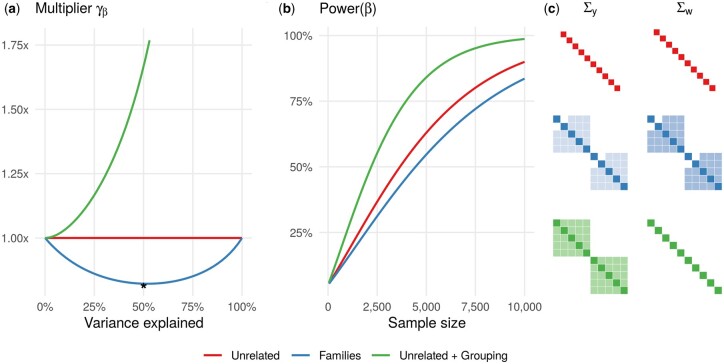
Figure 1.
The relative power of detecting marginal genetic effect β. (A) The ESS multiplier is less than one for the Families scenario and greater than one for the Unrelated+Grouping scenario compared to the baseline Unrelated scenario. The amount of variance explained by the random effect ( or ) varies from 0 to 100%. (B) The power of detecting β increases with the sample size at different rates for the Unrelated, Families, and Unrelated+Grouping scenarios. The random effect and genetic variant explain 50 and 1% of trait variance, respectively. (C) The covariance matrices of the trait and genetic variant Σy and Σw (used to compute ) are depicted when 50% of the trait variance is explained by the random effect (denoted by * on panel A).

