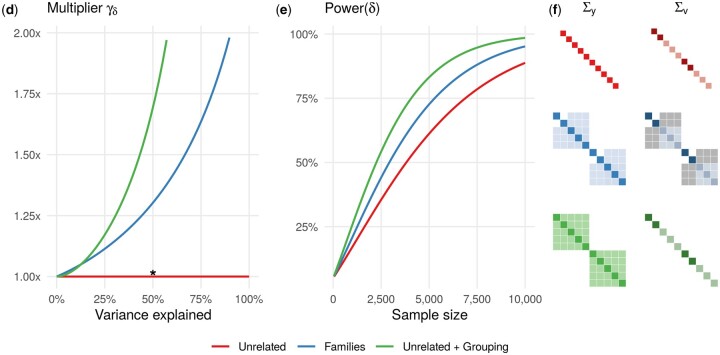
Figure 3.
The relative power of detecting the gene-environment interaction effect δ. The frequency of binary exposure is 0.6; the exposure status is fixed for the Families scenario such that two parents are unexposed and three offspring are exposed. (A) The ESS multiplier is greater than one for both Families and Unrelated+Grouping scenarios compared to the baseline Unrelated scenario. The amount of variance explained by the random effects ( or ) varies from 0 to 100%. (B) The power of detecting δ increases with the sample size at different rates for the Unrelated, Families and Unrelated+Grouping scenarios. The random effects (jointly) and the interaction variable explain 50% and 1% of trait variance, respectively. (C) The covariance matrices of the trait and interaction variable Σy and Σv (used to compute ) are depicted when 50% of trait variance is explained by random effects (denoted by * on panel A). The colored gradients in entries of matrices denote quantitative differences for positive values, while gray-colored entries correspond to negative values. The ratio between and is fixed to 0.1; both genetic and environmental variables also explain 1% of the trait variance in addition to 1% of the interaction variable.

