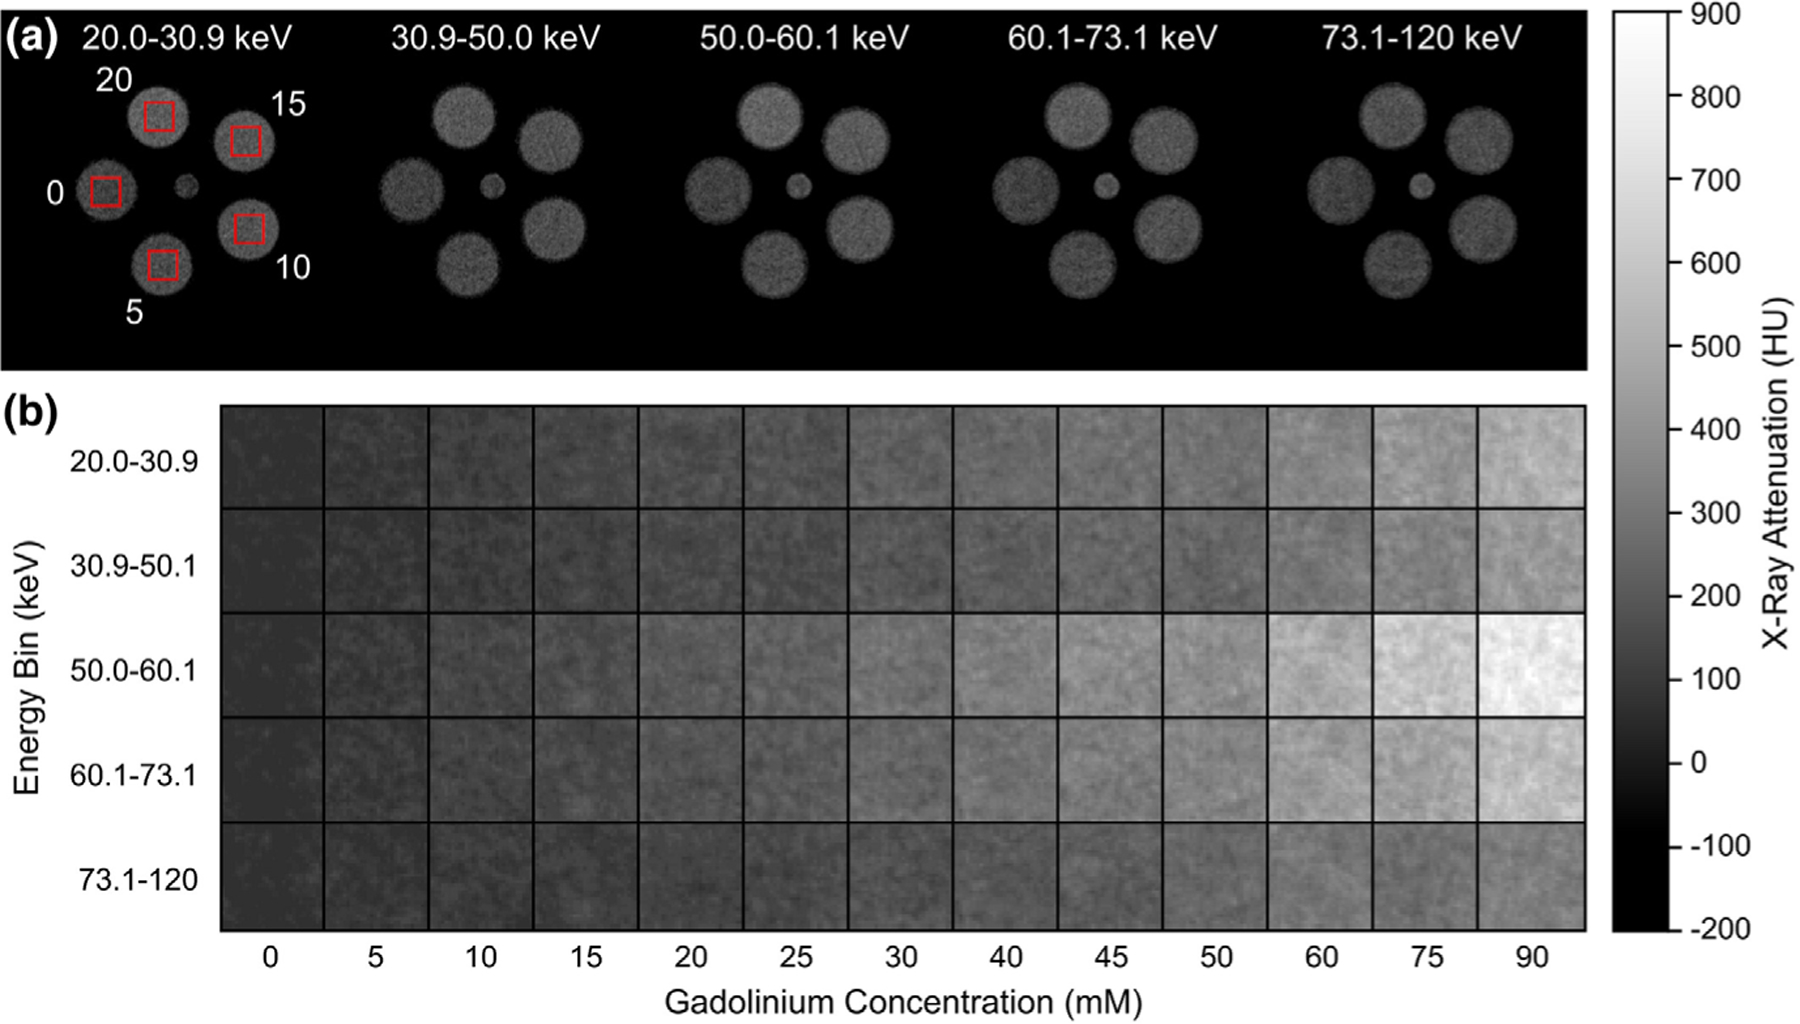
FIG. 6.

Representative (a) grayscale computed tomography image slices of a calibration phantom comprising of 0, 5, 10, 15, and 20 mM gadolinium concentrations showing example VOIs (boxes), and (b) cropped grayscale images of VOIs spanning the full range of gadolinium concentrations, for each energy bin of the photon-counting detector, demonstrating the increased attenuation of gadolinium in energy bins greater than the K-edge (50.2 keV). Note that all grayscale intensities were converted to HU. Figure reproduced from Curtis et al.265
