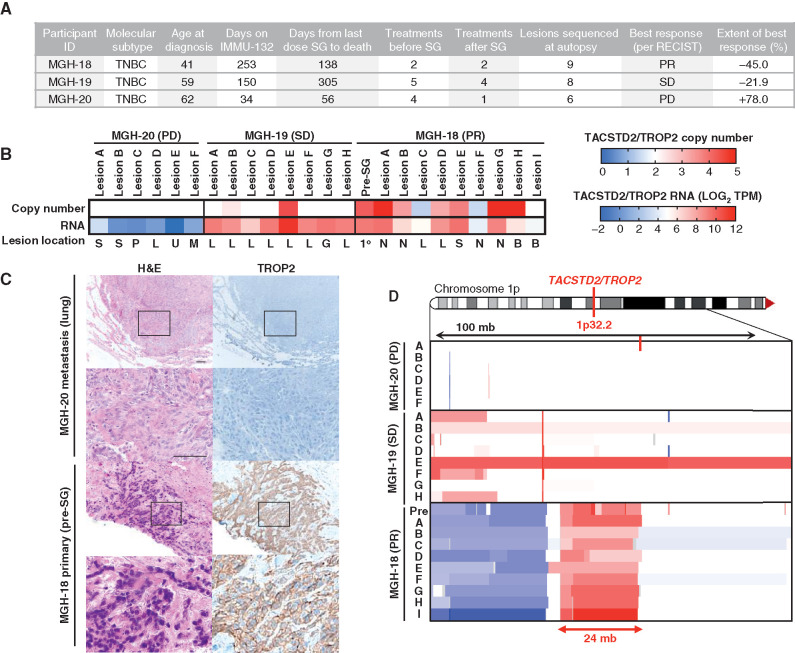
Figure 1.
TROP2 expression and gene copy number and response to SG. A, Clinical characteristics, treatment history, and SG response data for the three autopsy series patients. PR, partial response; SD, stable disease; PD, progressive disease. B, TACSTD2/TROP2 copy number (top) and RNA expression (bottom) for all analyzed tumor specimens from each case. Note, white indicates diploid copy number. Key for lesion location: S, subcutaneous; P, pericardium; L, liver; U, lung; M, mediastinum; G, gallbladder; N, lymph node; B, brain; 1o, primary breast tumor. C, Hematoxylin and eosin (H&E) and TROP2 IHC show tumor TROP2 protein expression is absent in MGH-20 but shows intense membrane staining in MGH-18. Scale bars, 50 μm. D, Focal amplification of TACSTD2/TROP2 in pretreatment primary tumor and multiple metastatic lesions from MGH-18. Copy-number scale per B is shown for the indicated region of chromosome 1p of each lesion, indicating up to N = 5 TACSTD2/TROP2 copies. See also Supplementary Fig. S1 and Supplementary Table S1.

