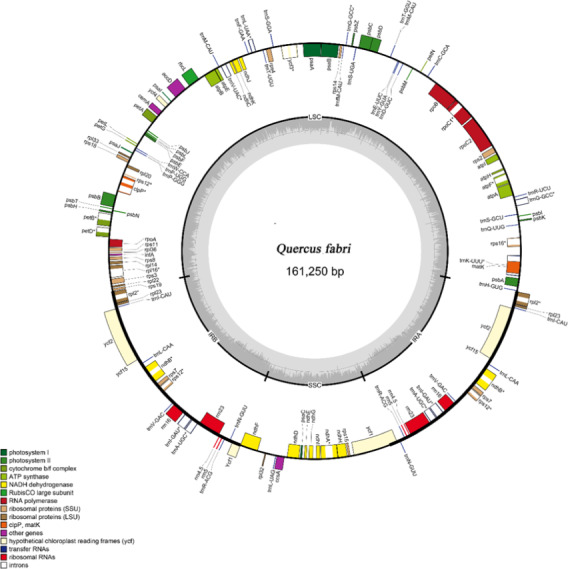
FIGURE 1.

Gene map of the Quercus fabri plastome. Genes displayed outside the circle are transcribed clockwise, while internal transgenes are transcribed counterclockwise. Genes belonging to different functional groups are color‐coded. The dashed line region in the inner circle represents the GC content of the plastome
