
FIGURE 3.
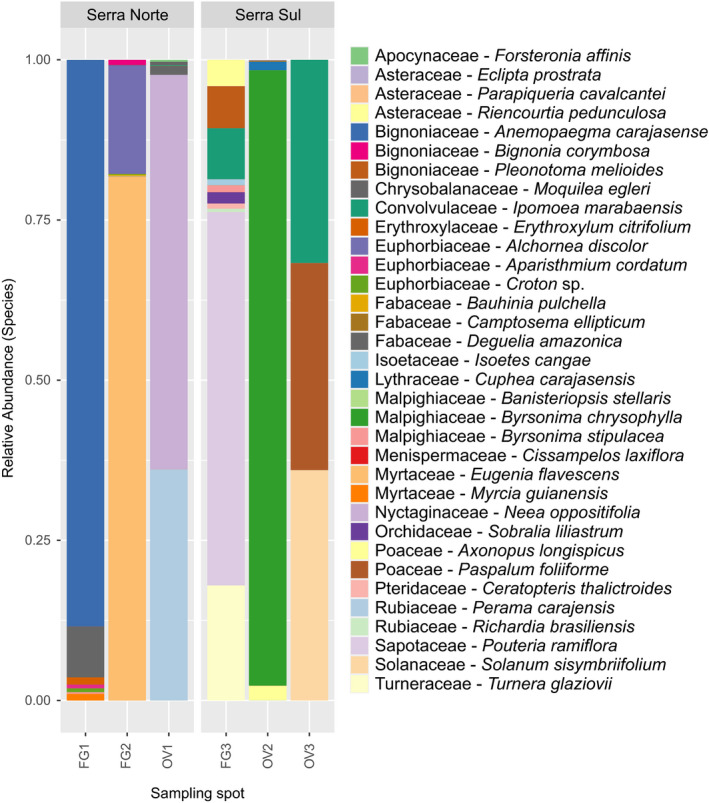
Relative abundance of the observed species in the DNA metabarcoding analysis with bulk samples collected in six different canga plots in the Serra dos Carajás, as detailed in the Table A3
Official websites use .gov
A
.gov website belongs to an official
government organization in the United States.
Secure .gov websites use HTTPS
A lock (
) or https:// means you've safely
connected to the .gov website. Share sensitive
information only on official, secure websites.
Relative abundance of the observed species in the DNA metabarcoding analysis with bulk samples collected in six different canga plots in the Serra dos Carajás, as detailed in the Table A3