Table 1.
MV anatomy and TTE imaging view.
| View | Measure or image | Explanatory note | Image |
|---|---|---|---|
| Parasternal long-axis view (PLAX) |
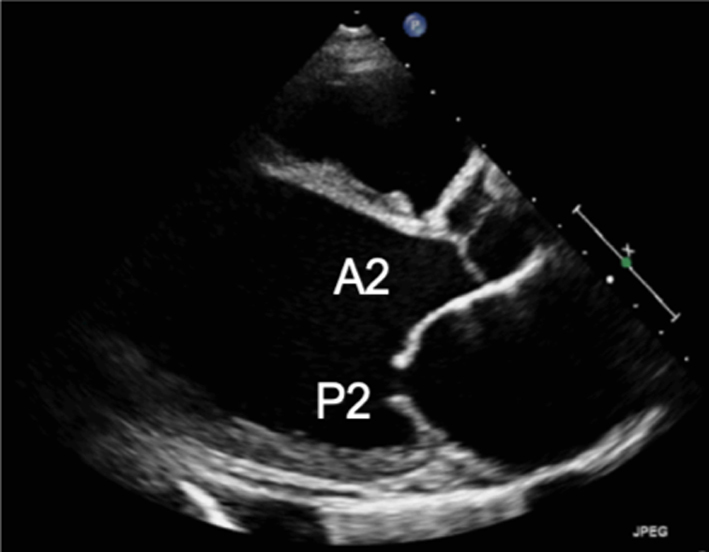
Image 1
Visual assessment of anatomy and leaflet excursion |
Demonstrate the anatomy and excursion of both mitral leaflets (anterior leaflet leading to the aortic valve, posterior leaflet extending from the base of the infero-lateral wall), the proximal chordae, subvalvular apparatus and annulus anatomy. Imaging in the standard PLAX plane demonstrates MV scallops A2 and P2 (7). Describe leaflet motion: normal, excessive, restricted. |
 |
| Leaflet thickness and calcification | Measure and report leaflet thickness. Describe the extent and distribution of calcification. | ||
|
Image 2
MV leaflet tip M-Mode |
M-Mode can be applied to demonstrate timing and extent of leaflet excursion. |  |
|
|
Image 3
Annular diameter – mid-systole |
Measure the anterior-posterior annular diameter in the PLAX view. Measurements can be made at end-systole or end-diastole. |  |
|
| Image 4 | End-systole is most often used to describe annular size. Measures should be made in mid-diastole when calculating MR volume, 1 frame after the leaflets start to close following early opening (although A4C measures are preferred). Annular dilation should be described in the report. | 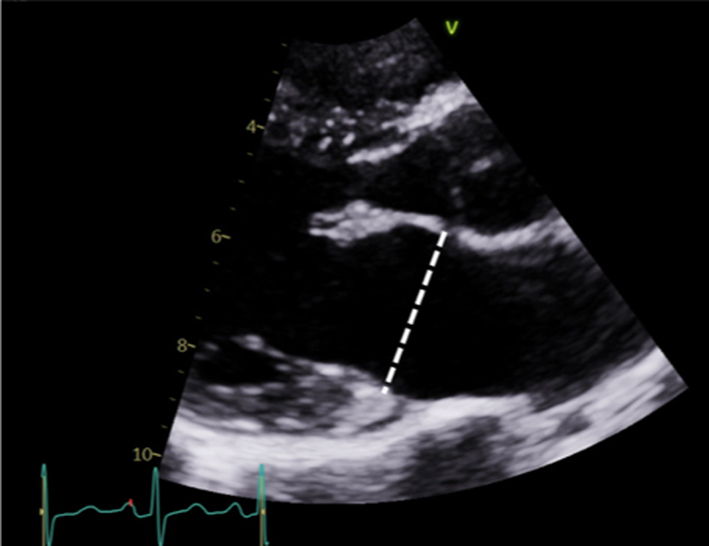 |
|
|
Image 5
2D tilting and multi-plane scanning to view all scallops |
Scallops A2 and P2 are viewed in the standard PLAX view. | 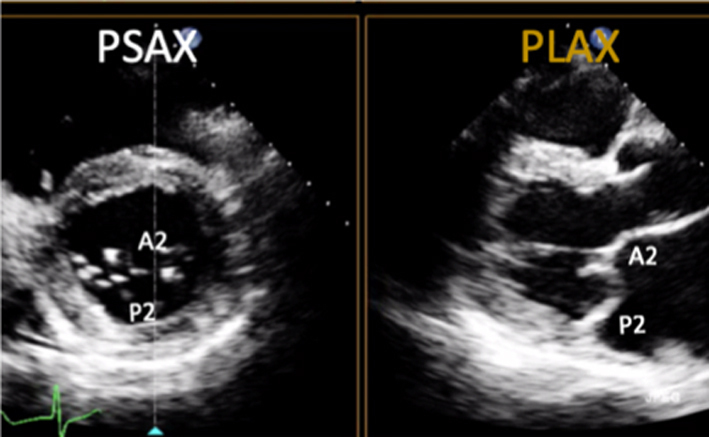 |
|
| Image 6 | Maintaining a focus on the MV leaflet tips while tilting the probe towards the RV inflow view (inferiorly) will demonstrate scallops A3 and P3 and eventually the P-M commissure. | 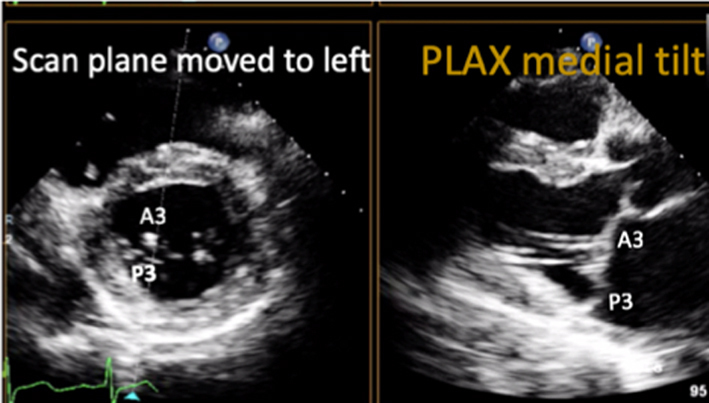 |
|
| Image 7 | Maintaining a focus on the MV leaflet tips and tilting the probe towards the RV outflow view (superiorly) will demonstrate scallops A1 and P1 and eventually the A-L commissure. The same segmental analysis can be performed by primary imaging in the PSAX with a secondary orthogonal plane image orientated to the PLAX view. CFD can be performed at all levels (7). |  |
|
| Parasternal short-axis view (PSAX) |
Image 8
Visual assessment of scallops and commissures |
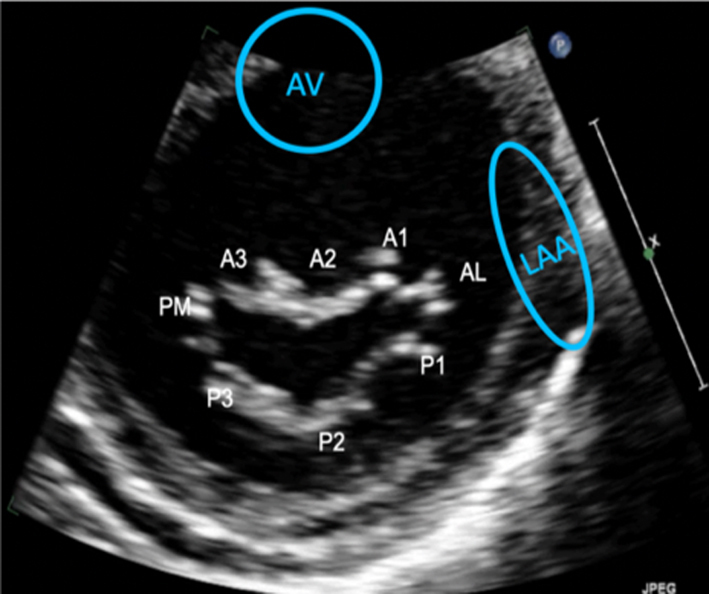
The PSAX imaging plane at the level of the MV is optimised to demonstrate the diastolic excursion of the mitral leaflet tips within the circular LV. Off-axis imaging results in an oblique cross-section imaging plane and oblique view of the leaflets. An off-axis and more longitudinal imaging plane resulting in the LV appearing more elliptic in shape. The ventricular surface of the MV leaflets is visualised in this view with scallops three to one seen from left to right. The PM commissure is adjacent to A3/P3 and the A-L commissure adjacent to A1/P1. Qualitative assessment of leaflet morphology, thickness and excursion is assessed visually. CFD is placed over the MV. Tilting back and forth through the plane of coaptation will demonstrate the regurgitant orifice position (1). |
 |
|
Image 9A 3D imaging: the normal MV viewed from the LA in systole |
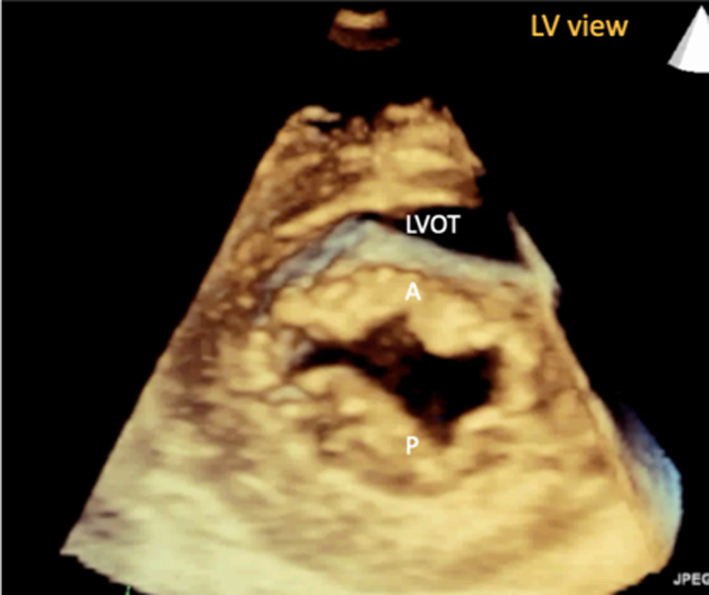
3D imaging provides visualisation of the whole valve anatomy and can help identify regurgitant orifice position and size. Adjust the dataset dimensions to include the entire annulus and leaflet tips in both orthogonal viewing planes, ensuring to include the entirety of the non-planar annulus. Optimise the image by adjusting gain and compression. The image can then be orientated into the surgeon's view to demonstrate the atrial surface of the leaflets. | 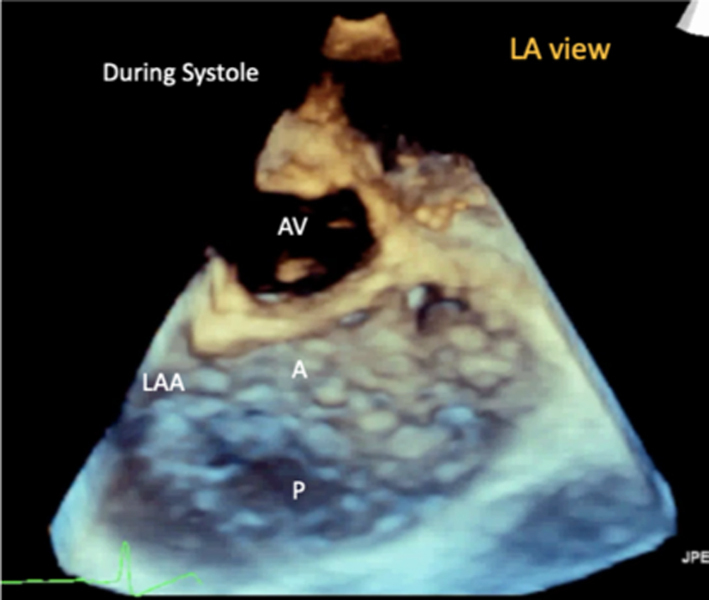 |
|
|
Image 9B 3D imaging: the MV viewed from the LV in diastole |
 |
||
|
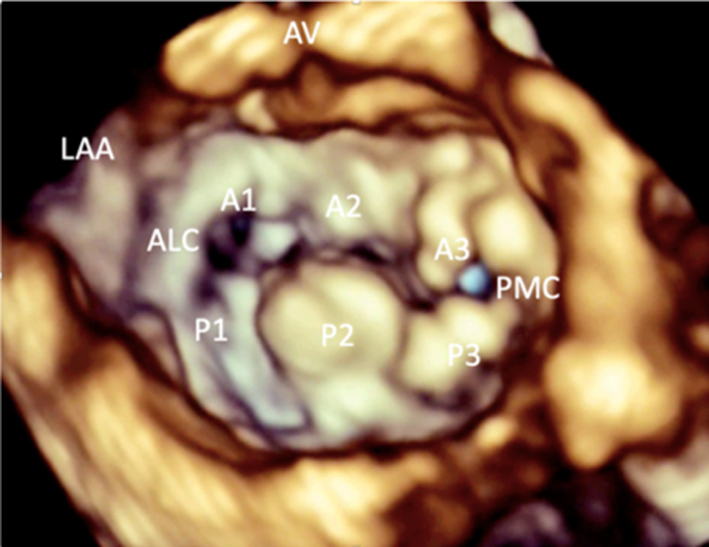
Image 9C 3D imaging: LA view of an abnormal MV demonstrating P2 prolapse |
 |
||
| PSAX – papillary muscle level |
Image 10
Visual assessment of the papillary muscle |
The postero-medial papillary muscle is seen on the left of the image, the antero-lateral papillary muscle is seen on the right. | 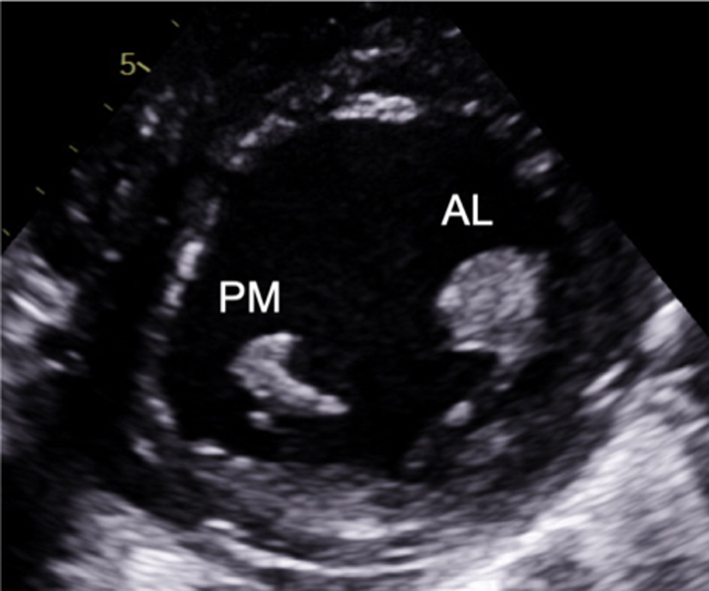 |
| Image 11 | Myxomatous degeneration of the MV may be associated with multiple and diffuse spreading of the papillary muscle and should be reported. | 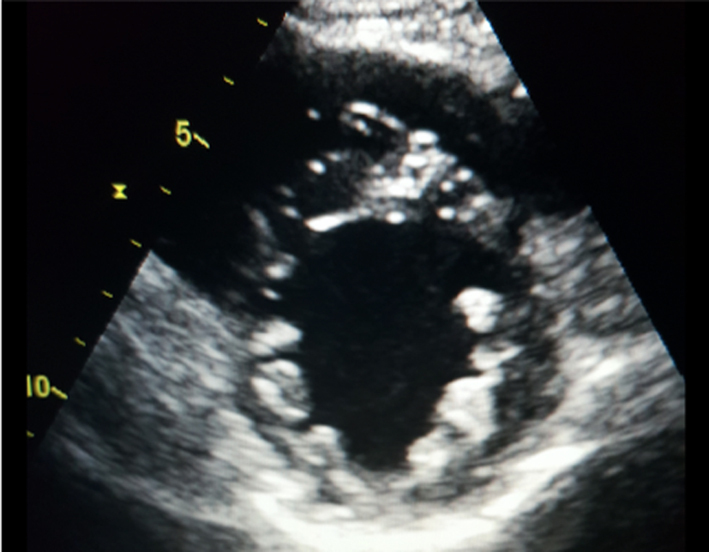 |
|
| Apical four-chamber view (A4C) |
Image 12
Visual assessment of the leaflets and scallops – arrowed line demonstrates the imaging plane of the A4C view |
Assess and describe the anatomy and excursion of both mitral leaflets, describing the location and extent of any excessive or restricted motion. | 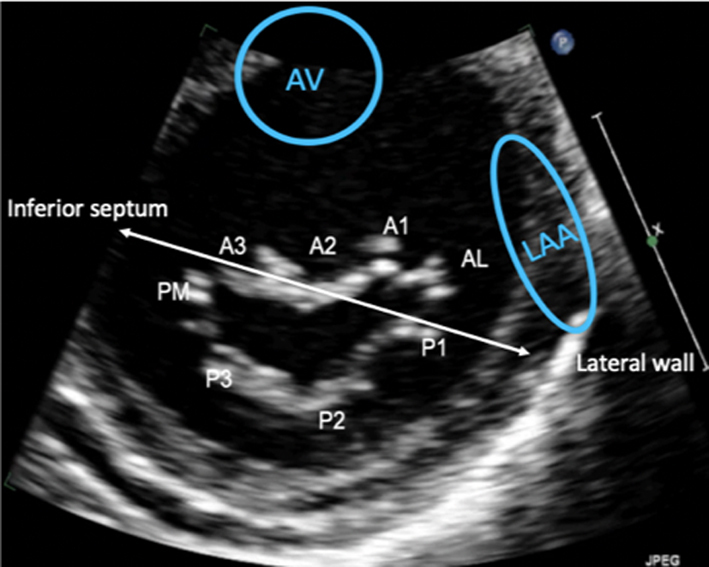 |
| Image 13 | The anterior leaflet is seen closer to septum, the posterior leaflet adjacent to infero-lateral wall. The scallops typically imaged in the A4C view are: A3/A2 and P1. | 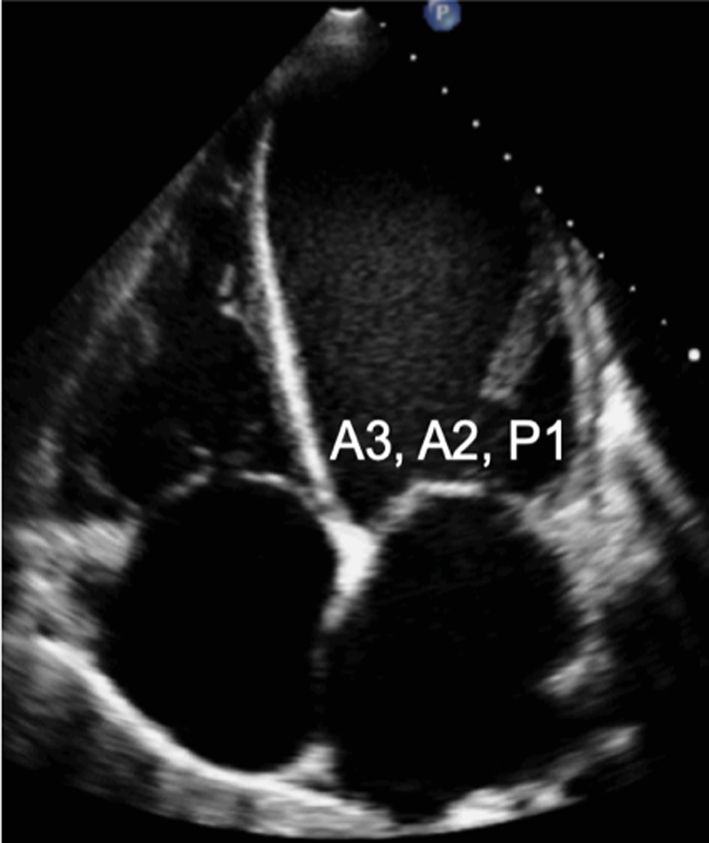 |
|
| Apical two-chamber view (A2C) |
Image 14 Visual assessment of the leaflets and scallops – arrowed line demonstrates the imaging plane of the A2C view |
The A2C view is optimised to demonstrate the inferior and anterior LV walls. | 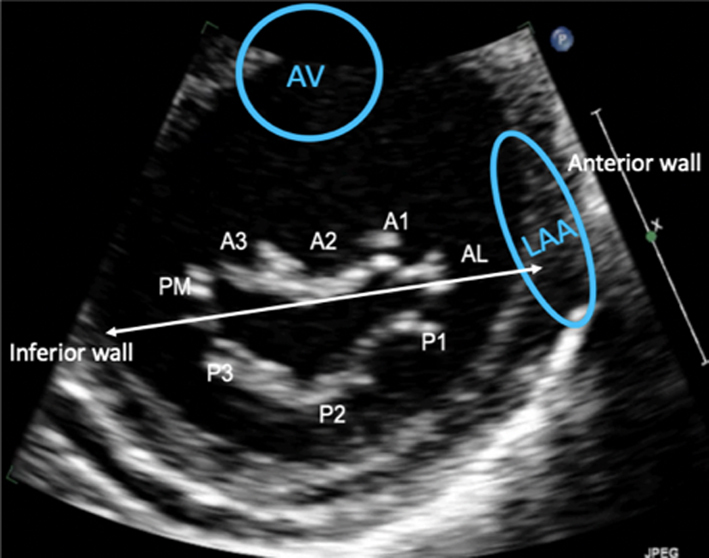 |
| Image 15 | In this view, the MV leaflets are: P3 adjacent to the inferior wall, P1 adjacent to the anterior wall and anatomically inferior to the LAA (superior in the image) with A2 seen in the centre of the valve. | 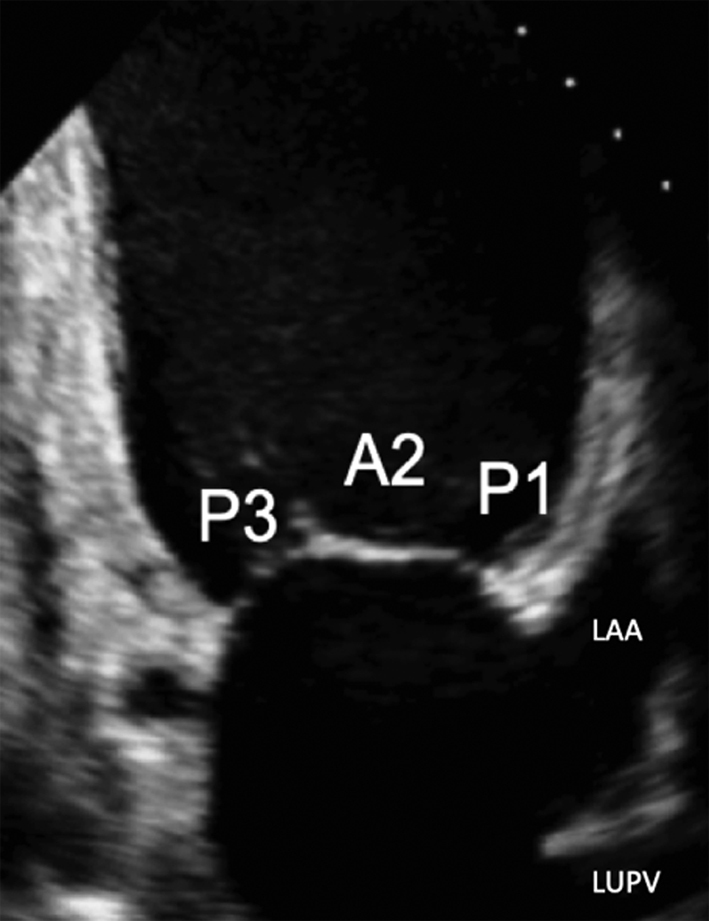 |
|
| A2C view |
Image 16
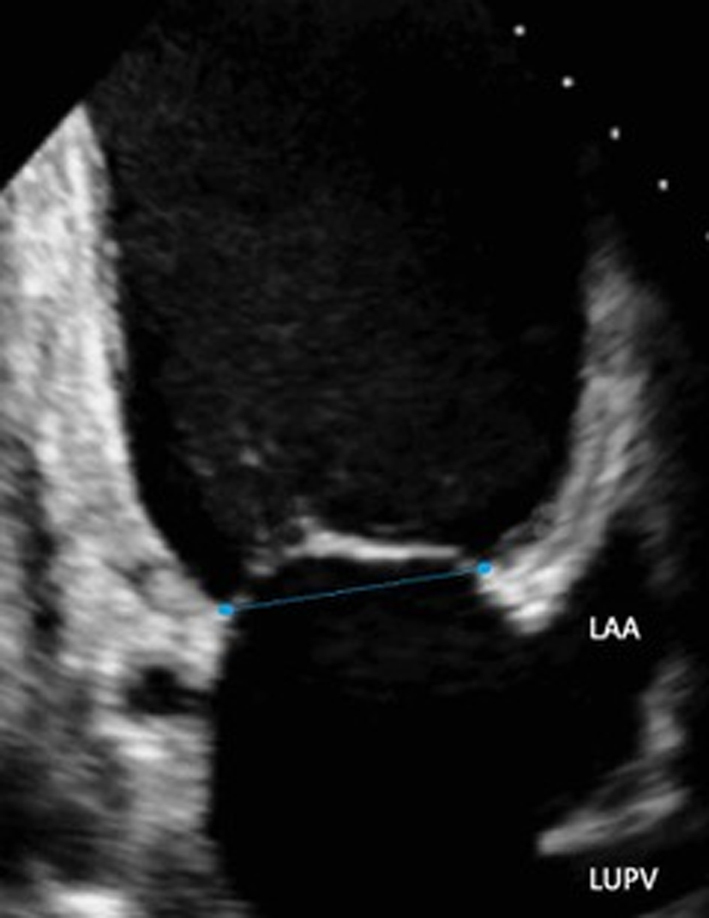
Commissural diameter measure |
 |
|
| Apical three-chamber view (A2C) |
Image 17 Visual assessment of the leaflets and scallops – arrowed line demonstrates the imaging plane of the A3C view |
The A3C view is optimised to demonstrate the antero-septum and the infero-lateral wall. When achieved, the imaging plane is through the centre of the MV, demonstrating scallops A2 and P2. | 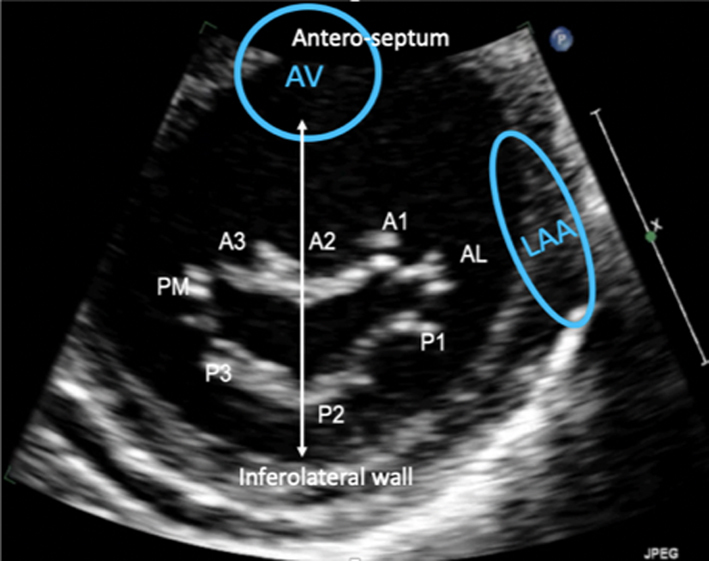 |
| Image 18 | 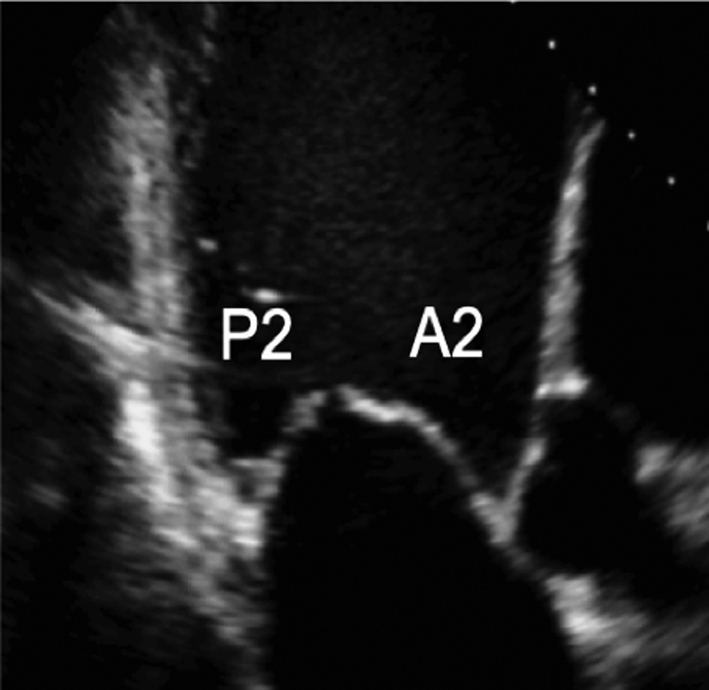 |

 This work is licensed under a