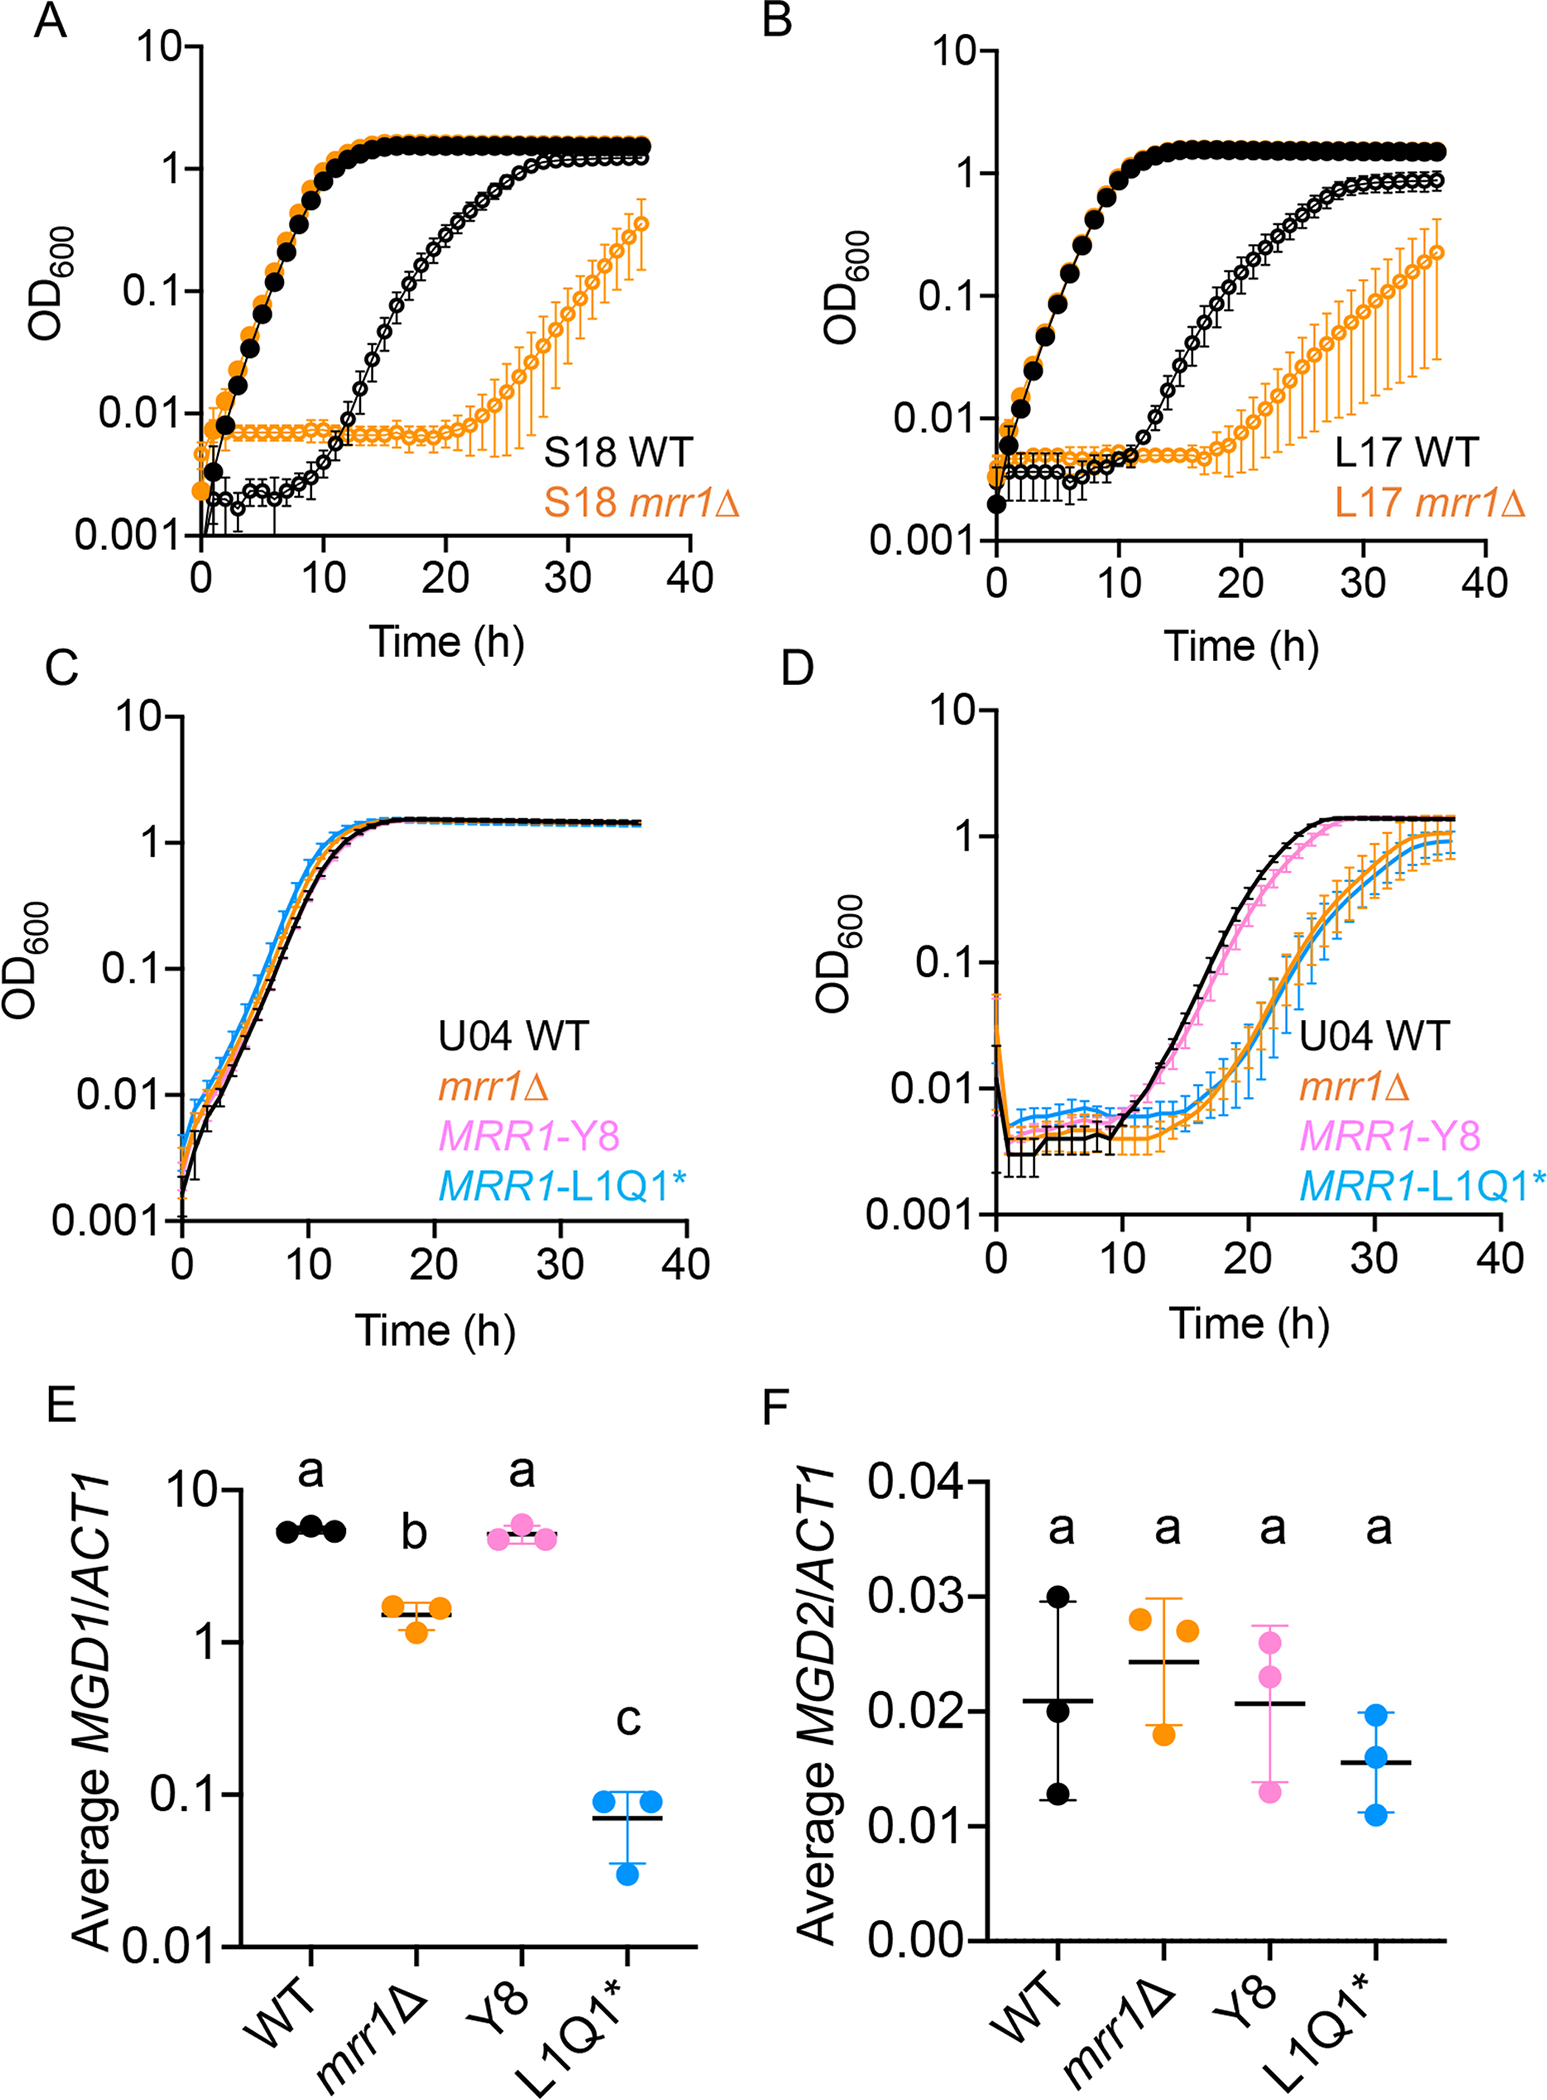
Fig. 3. Mrr1 regulates MG resistance and basal expression of MGD1 but not MGD2.

(A-B) Growth curves of C. lusitaniae S18 (A) and L17 (B) wild type (black) and mrr1Δ (orange) in YPD alone (closed circles) or with 15 mM MG (open circles). One representative experiment out of three independent experiments is shown; error bars represent the standard deviation of technical replicates within the experiment. (C-D) Growth curves of C. lusitaniae U04 (black), U04 mrr1Δ (orange), U04 mrr1Δ + MRR1Y8 (pink) and U04 mrr1Δ + MRR1L1Q1* (light blue) in YPD alone (C) or with 15 mM MG (D). One representative experiment out of three independent experiments is shown; error bars represent the standard deviation of technical replicates within the experiment. (E-F) Expression of MGD1 (E) and MGD2 (F) in C. lusitaniae U04 WT (black), U04 mrr1Δ (orange), U04 mrr1Δ + MRR1Y8 (pink) and U04 mrr1Δ + MRR1L1Q1* (light blue). Data shown represent the mean ± SD from three independent experiments. Ordinary one-way ANOVA with Tukey’s multiple comparison test was used for statistical evaluation in (E-F); a-b and a-c, p < 0.0001; b-c, p < 0.01.
