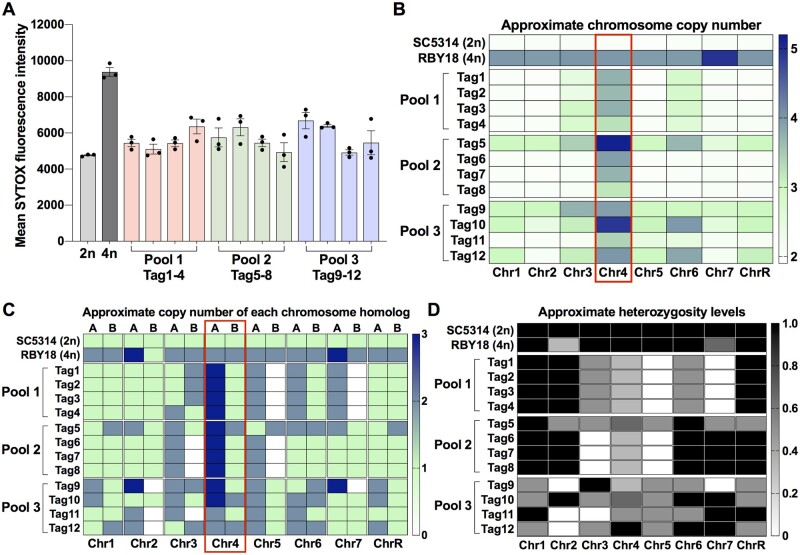
Figure 4.
Karyotypic analysis of progeny following growth of tetraploid cells in D-tagatose and selection for 2-DOGR colonies. (A) Flow cytometry analysis of DNA content for diploid strain SC5314, tetraploid strain RBY18 and twelve 2-DOGR isolates derived from RBY18 cells that had been grown in D-tagatose-containing medium (Tag1–12). Tag1–12 isolates represent single colonies obtained from three separate pools and are grouped according to the pool of origin. Lines indicate mean SYTOX green fluorescence intensity ± SEM. (B, C) Heatmaps indicate estimated copy numbers for each chromosome (B) and each chromosome homolog (C) across all eight chromosomes. (D) Heatmap shows heterozygosity levels across chromosomes, with 0 indicating whole chromosome LOH and 1 indicating no LOH.

