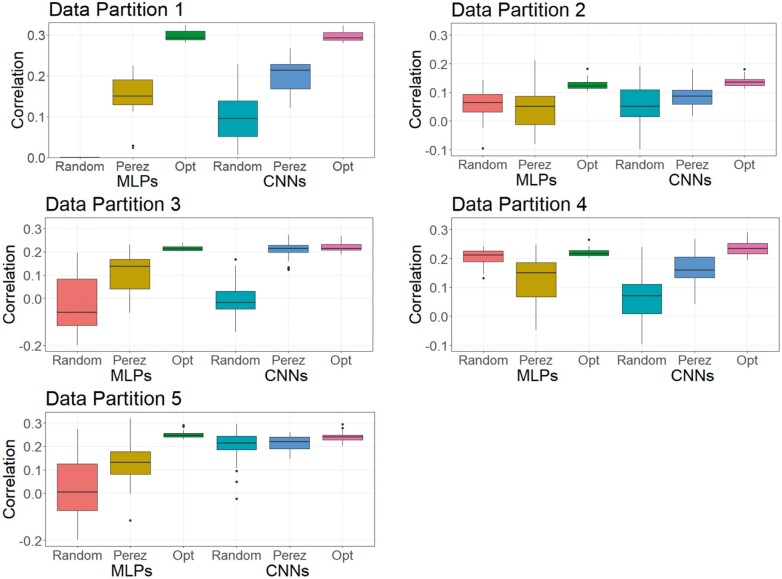
Figure 10.
Boxplots for the predictive performance of MLPs and CNNs using different hyperparameters (real pig dataset). Models were tested on five data partitions of the real pig dataset. Statistics represent external (cross) validations by fitting the same model 30 times. The left three boxes are for MLP models, and the right three boxes are for CNN models. Null box means the model did not converge.

