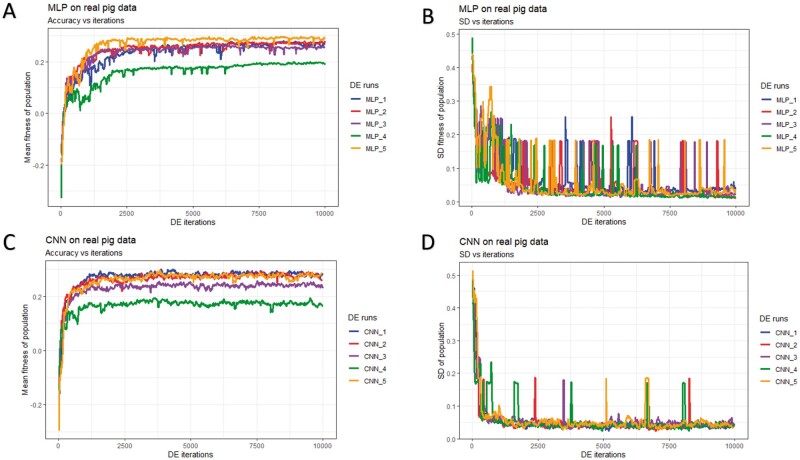
Figure 7.
History of DE by algorithm and data partition in the real pig dataset over 10,000 iterations. Mean and SD were computed given each population. (A) Mean fitness of five populations by fitting MLP models. (B) SD of fitness within each population (MLPs). (C) Mean fitness of five populations by fitting CNN models. (D) SD of fitness within each population (CNNs).

