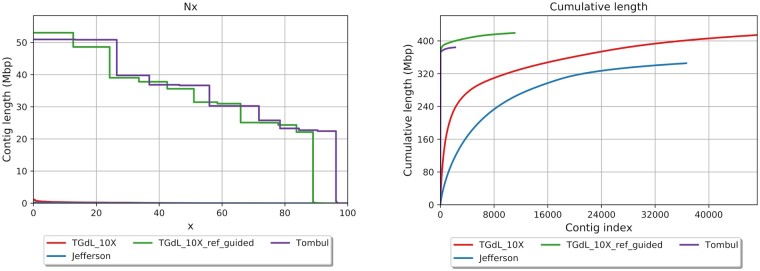
Figure 1.
Contiguity statistics performed on “TGdL” (contigs), “TGdL” (pseudomolecules plus unplaced scaffolds), “Tombul” (pseudomolecules), and “Jefferson” genomes. Left picture: Nx statistics (Nx is the largest contig length, L, such that using contigs of length ≥ L accounts for at least x% of the bases of the assembly) with x varying between 1 and 100. Right picture represents the cumulative length increment of the genome through the scaffold/contig addition.

