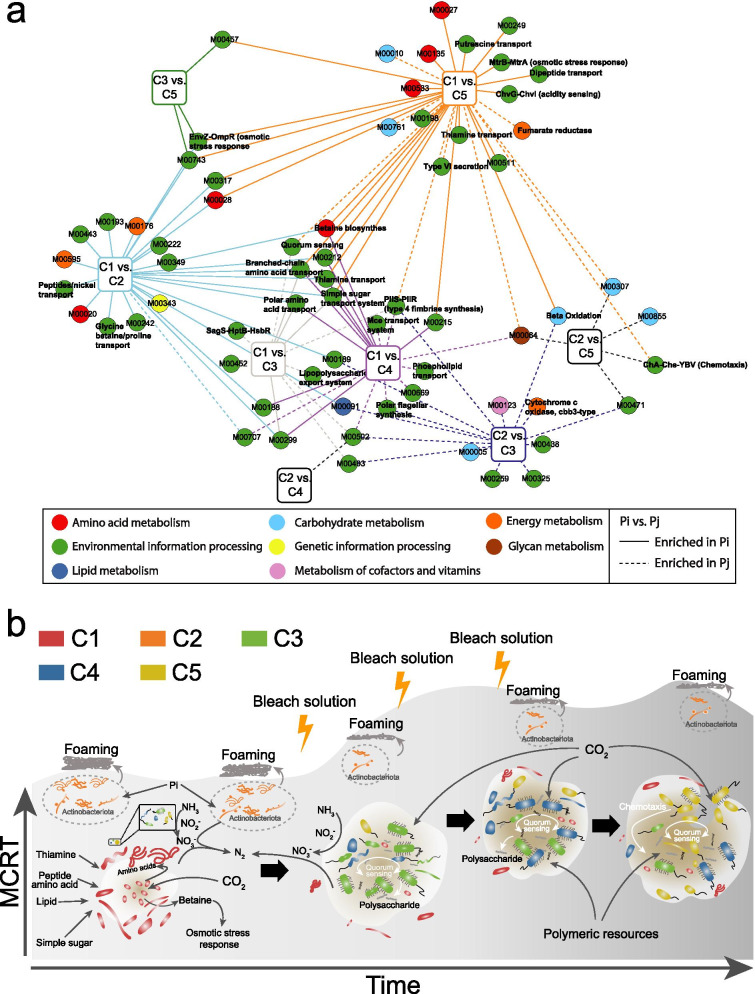
Fig. 5.
Comparative genomic analysis. a Pairwise comparison of enriched metabolic modules between two microbial cohorts. Each circle node represents > 60% steps/reactions of a specific metabolic module that are significantly enriched in given microbial cohort. Node color represents different standard KEGG categories. The solid line and dash line represent metabolic modules enriched in which cohort when conducting pairwise comparison. Details of enriched modules can be found in Supplementary Table S9. b Schematic overview of microbial dynamics and morphological changes over time. Microorganisms from different cohorts are represented with different colors. The morphological change of sludge over time was predicted based on comparative genomic analysis

