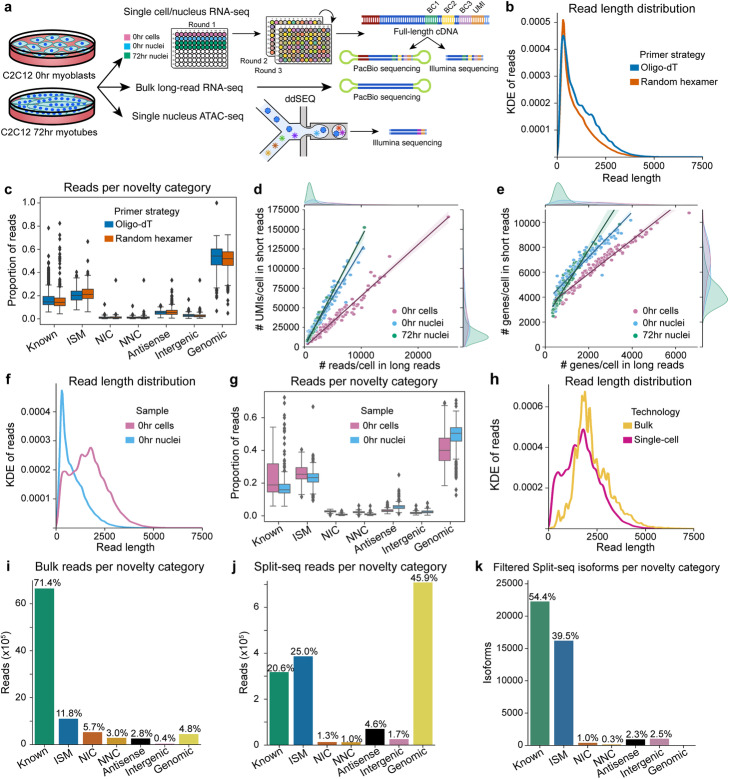
Fig. 1.
Technical comparisons in LR-Split-seq and bulk long-read RNA-seq. a Schematic diagram of experimental design. Single cell/nucleus LR-Split-seq, short-read Split-seq, bulk long-read RNA-seq, and single nucleus ATAC-seq were performed on C2C12 0 h myoblasts and 72 h differentiating cells. The same single-cell/UMI-barcoded cDNA was used in both short-read and long-read sequencing. b Kernel density estimation (KDE) of read length distribution of oligo-dT primed reads (blue) compared to random hexamer primed reads (orange). c Proportion of oligo-dT/random hexamer reads in each cell for each novelty category. d Comparison of number of reads and e genes detected between short and long reads. Cells are labeled by sample type (0 h cells in pink [regression m = 1.4 and 6.5 in genes and reads respectively], 0 h nuclei in blue [regression m = 1.8 and 12.0 in genes and reads respectively], and 72 h nuclei in green [regression m = 2.7 and 13.9 respectively]) and marginals on the top and right indicate their distributions. f KDE read length distribution of 0 h cells (pink) compared to 0 h nuclei (blue) reads, not including genomic reads. g Proportion of 0 h cell (pink)/nuclei (blue) reads per cell/nucleus per novelty category. h KDE read length distribution of bulk long reads (yellow) compared to single-cell long reads (magenta), not including genomic reads. i Unfiltered reads per novelty category in bulk long-read data and j LR-Split-seq data. k Filtered isoforms per novelty category across all cells in LR-Split-seq data

