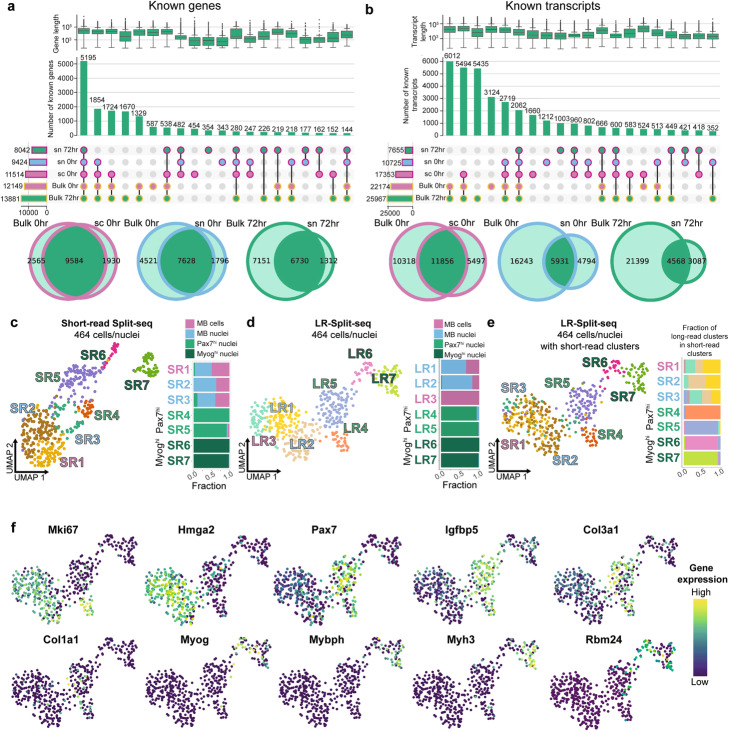
Fig. 2.
LR-Split-seq in C2C12 0 h and 72 h samples recapitulates results from companion bulk and standard short-read Split-seq. a Upset plots of known genes found in bulk compared to LR-Split-seq data across all samples. Bars on the left indicate set size, circles indicate combinations of samples, and bars on top indicate the number of genes found in each combination (first 20 combinations shown). Outline colors indicate technology (bulk in yellow, single-cell or single-nucleus in magenta) and fill colors indicate sample type (72 h nuclei in green, 0 h nuclei in blue, and 0 h cells in pink for single-cell data; 72 h in green, 0 h in pink for bulk data). Box plots above indicate gene length distribution for each intersection. Venn diagrams below summarize the overlaps between bulk (left) and single-cell or single-nucleus (right), for each sample type. Sample type is indicated by outline color. b Upset plot and Venn diagrams of known transcripts found in bulk data and LR-Split-seq data (first 20 combinations shown). c UMAP of 464 short-read Split-seq cells/nuclei labeled by 7 Leiden clusters (S) and breakdown of cell type per cluster: 110 0 h cells (pink), 145 0 h nuclei (blue), and 209 72 h nuclei (Pax7hi in green and Myoghi in dark green). d UMAP of 464 LR-Split-seq cells/nuclei using gene-level data labeled by 7 Leiden clusters (LR) and e Leiden cluster ID of matching short-read data (SR) shown in c, as well as long-read cluster makeup of each short-read cluster. f Expression of marker genes, dark blue = lowly expressed, yellow = highly expressed

