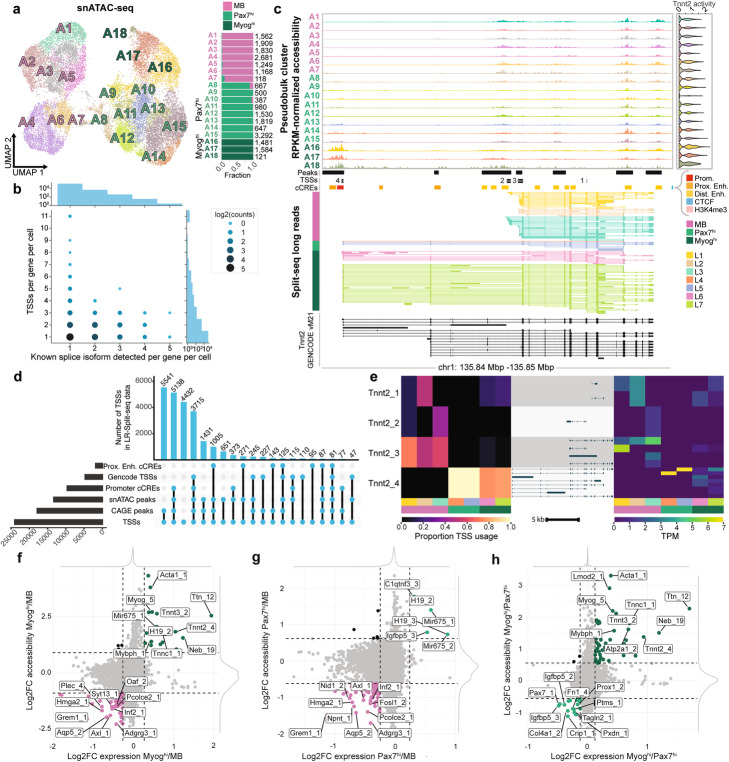
Fig. 4.
Identification of TSSs from LR-Split-seq and integration with snATAC-seq. a UMAP of 23,525 snATAC-seq nuclei labeled by 18 Leiden clusters (A) and breakdown of cell type per cluster with number of cells per cluster on right: 10,508 0 h myoblast nuclei (pink) and 13,017 72 h nuclei (Pax7hi in green and Myoghi in dark green). b Bubble plot of the number of distinct known splice isoforms per gene per cell compared to the number of distinct TSSs per gene per cell in LR-Split-seq. c Track plot of alternative Tnnt2 TSS usage between 72 h differentiating cells and 0 h myoblasts. From top to bottom: clustered snATAC-seq pseudobulk peaks, merged psuedobulk peaks, TSS regions called from LR-Split-seq, ENCODE cCREs, clustered LR-Split-seq reads used to call TSSs, and comprehensive set of GENCODE vM21. d Validation of TSSs found in LR-Split-seq using four external datasets and snATAC-seq pseudobulk peaks (first 20 intersections shown). e Left, proportion of TSS-assigned reads in LR-Split-seq clusters from each identified Tnnt2 TSSs. Right, expression of each TALON filtered Tnnt2 isoform in LR-Split-seq clusters with corresponding transcript models associated with each Tnnt2 TSS. f Comparison of log2 fold change (LFC) in expression and accessibility across identified TSSs: Myoghi (+LFC) compared to MB (-LFC), g Pax7hi (+LFC) compared to MB (-LFC), and h Myoghi (+LFC) compared to Pax7hi (−LFC)

