Fig. 3.
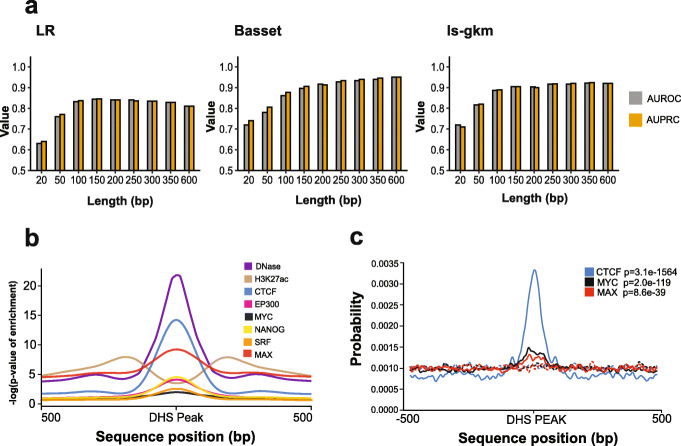
Exploration of regulatory element length. a Three ML models (LR, Basset, and ls-gkm) were trained (except Basset) and tested on various DHS lengths as input. Positives were DHS sites obtained from the ESC-H1 cell line. Negatives were random DNA regions of equal length as the positive and matched for GC and repeat element content. b Metagene plots for DHS, H3K27ac, EP300, and four TFs in the ESC-H1 cell line. Read signals (negative log p-value of signal over control) were averaged at bp resolution (using data from bigwig files) across the regions using DHS peak as reference. c Motif enrichment results using Centrimo. Dotted lines correspond to dinucleotide shuffled positives

