Fig. 4.
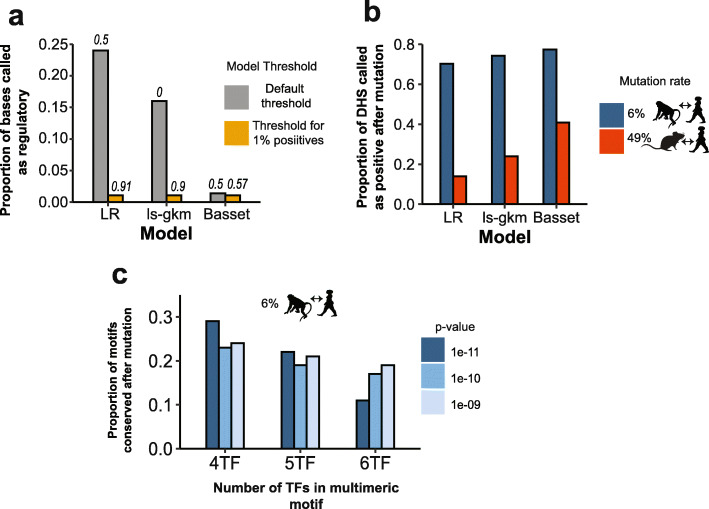
Turnover of regulatory regions based on simulated mutations at neutral rate. a Proportion of bases identified as regulatory by the three models based on DHS data in the ESC-H1 cell line. Gray represents the intrinsic model threshold (in italics), whereas the yellow bars represent the modified threshold to obtain ~ 1% positive rate. b Proportion of DHSs called as positives (based on scoring the test set using the models) after simulated mutations at the neutral rate between human/macaque (6%) and human/mouse (49%). c Proportion of multimeric motif hits (at p-values corresponding to unique hits) conserved in the axolotl genome (32 Gb) after simulated mutations at the neutral rates between human/macaque and human/mouse. Silhouettes were obtained from PhyloPic

