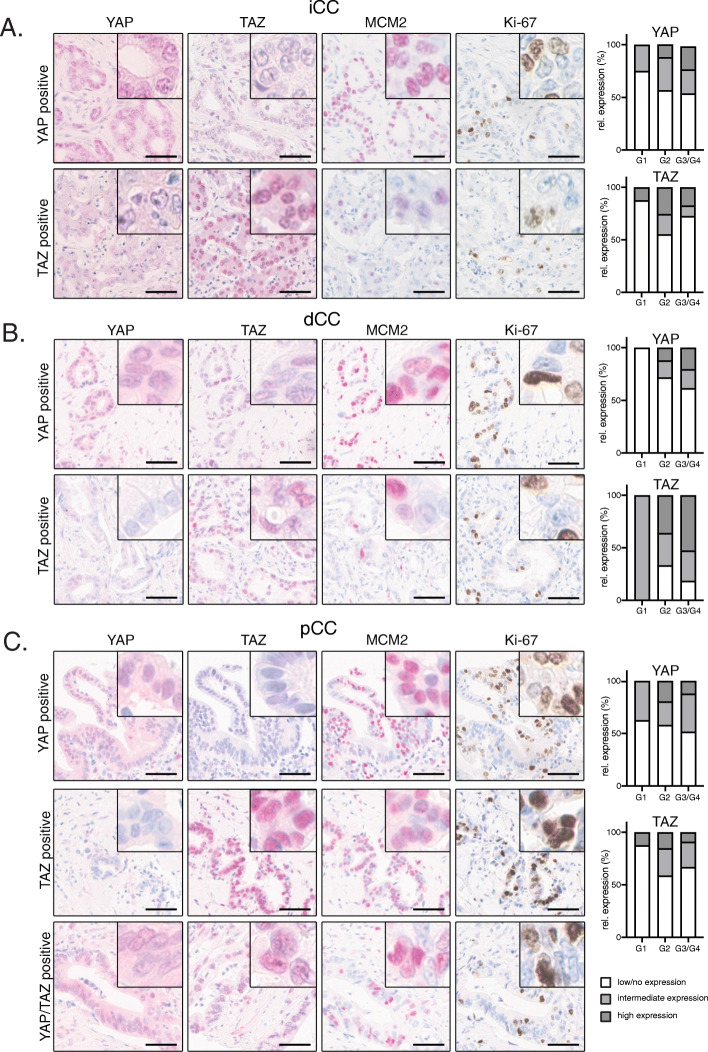
Fig. 1.
YAP and TAZ expression in human iCCA, pCCA and dCCA. Representative IHC stains for YAP, TAZ, MCM2 and Ki-67 in cohorts of CCA subgroups of iCCA (A, n = 152), dCCA (B, n = 126) and pCCA (C, n = 155). For each subtype, a representative YAP and TAZ-positive example is shown. For pCCA an additional case with nuclear YAP/TAZ is shown. Bars: 50 μm. Adjacent bar graphs illustrate the relative nuclear positivity of YAP or TAZ for the respective CCA subgroup with regard to tumor grading (white: low/no expression; light grey: intermediate expression; dark grey: high expression)

