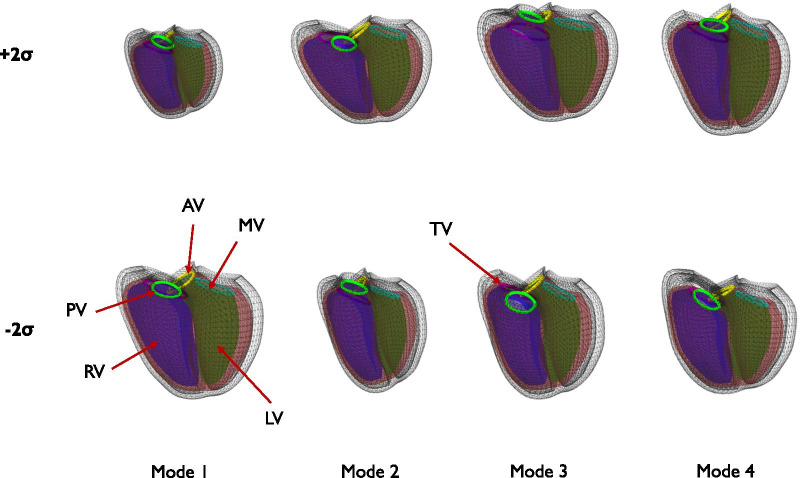
Fig. 3.
Principal component shape modes. Wireframe shows model at ED and shaded surfaces show the model at ES. Green: LV; Purple: RV; Maroon: Epicardium; Yellow: Aorta; Cyan: Mitral; Light green: Pulmonary; Pink: Tricuspid. Top rows show mean plus two standard deviations. Bottom row shows mean minus two standard deviations. PV pulmonary valve, AV aortic valve, TV tricuspid valve, MV mitral valve. See Additional file 1 for animations of these modes. To better visualize the change in function, motion was linearly interpolated between ED and ES shapes

