
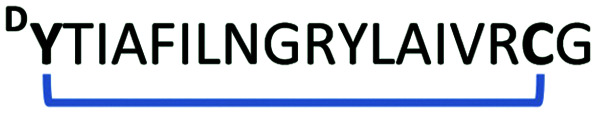
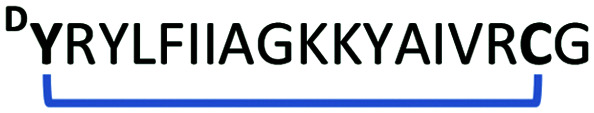
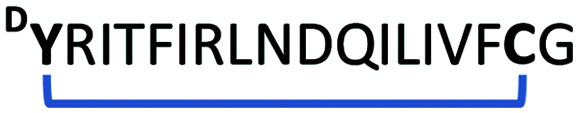
Sequences, abundance and IC50 values for selected macrocyclic peptides initiated with l-tyrosine (Y) or d-tyrosine (DY). The residues in bold and the blue lines highlight the location of the thioether linkage.
| Peptide | Sequence | Abundancea (%) | IC50b (μM) |
|---|---|---|---|
| 1 |

|
9.5 | 4.964 ± 0.509 |
| 2 |

|
1.4 | 1.584 ± 0.111 |
| 3 |

|
1.1 | 1.115 ± 0.066 |
| 4 |

|
1.1 | 0.772 ± 0.054 |
| 5 |

|
0.7 | 1.125 ± 0.076 |
| 6 |

|
0.6 | 0.674 ± 0.042 |
| 7 |

|
0.6 | 5.344 ± 0.432 |
| 8 |

|
0.5 | 2.238 ± 0.211 |
| 9 |

|
6.6 | 4.426 ± 0.428 |
| 10 |

|
6.241 ± 0.889 | |
| 11 |

|
5.7 | 1.131 ± 0.080 |
| 12 |
|
5.4 | 1.209 ± 0.113 |
| 13 |

|
2.6 | 0.241 ± 0.012 |
| 14 |
|
1.2 | 7.058 ± 0.530 |
| 15 |
|
1.1 | 0.437 ± 0.023 |
| 16 |

|
1.1 | 1.238 ± 0.100 |
| 17 |

|
0.9 | 0.229 ± 0.007 |
a
Percentage of total sequences after the sixth round of enrichment. Peptides 1–8 originate from the selection initiated with l-tyrosine or and peptides 9–17 originate from the selection initiated with d-tyrosine.
b
Half-maximal inhibitory concentration of the compounds tested against human wild-type NNMT (full assay details provided in the ESI). Values reported in μM are based on triplicate data of at least 10 different concentrations.