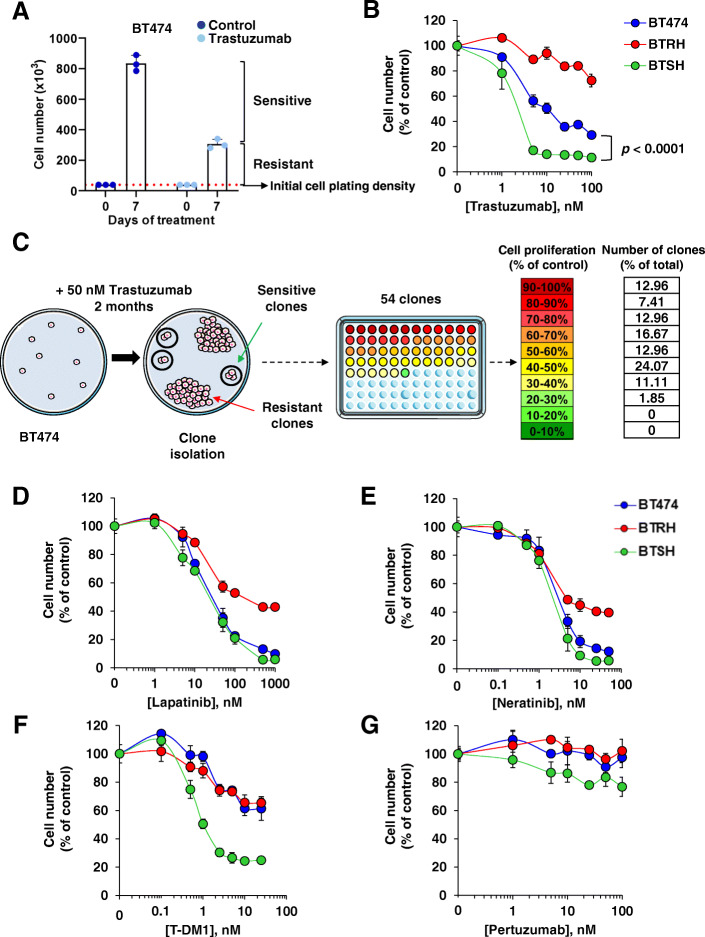
Fig. 1.
Generation and characterization of trastuzumab-resistant and hypersensitive cells. A Proliferation of BT474 cells in the presence of trastuzumab. Cells were treated with trastuzumab 50 nM for 7 days and cell number was measured by cell counting experiments. Treatment affects a population of sensitive cells while a resistant population escaped form trastuzumab action. Data are represented as mean ± SD, normalized to untreated controls. B Response of BT474 and their trastuzumab-resistant and hypersensitive models to trastuzumab assessed in dose-response experiments by cell counting at 7 days. Data are represented as mean ± SD, normalized to untreated controls. C Schematic representation of clones with distinct trastuzumab sensitivity generation. BT474 cells were seeded at low density and treated with trastuzumab for 2 months. Fifty-four clones were isolated and cell proliferation in the presence of trastuzumab was evaluated. Colors in the 96 well plate represents the proliferation rate after trastuzumab treatment of each clone as indicated. The percentage of clones belonged to each proliferation group normalized to the total amount of clones is indicated. Susceptibility of BT474, BTRH and BTSH to lapatinib (D), neratinib (E) and T-DM1 (F) treatment for 3 days and pertuzumab (G) for 7 days was determined by dose-response assays. Cell number was determined by cell counting assay. Data are represented as mean ± SD of triplicates, normalized to untreated controls

