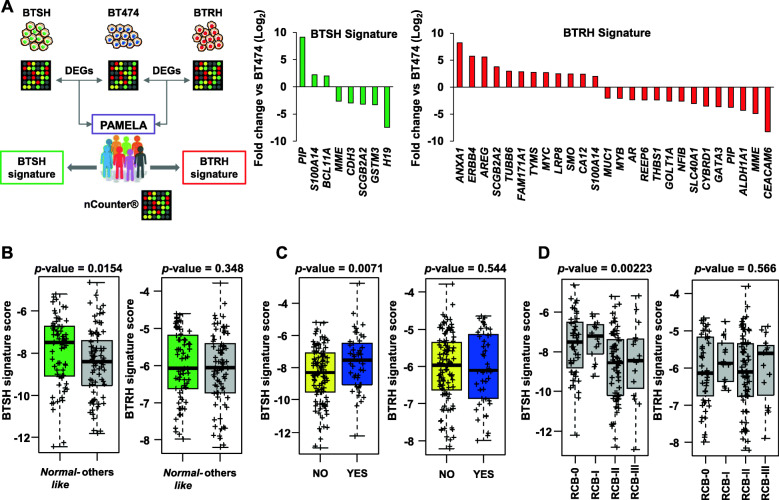
Fig. 5.
BTSH gene signature is enriched in patients who responded to dual HER2 blockade. A A trastuzumab-hypersensitive and a trastuzumab-resistance gene signatures were generated by the overlapping of DEGs identified on microarray analysis performed in BT474, BTRH and BTSH cells with gene expression data from PAMELA’s patients obtained by nCounter platform. Graphs show genes involved in BTSH (left) and BTRH (right) signatures and their fold change compared to parental BT474 cell line. B, C and D Both BTSH and BTRH gene expression signatures were evaluated in PAMELA’s samples as the sum of the mean of the genes from the upregulated list and the mean of downregulated gene list. Correlation of gene signature expression and response to dual HER2 blockade was analyzed by PAM50 at day 14 (B), pathological complete response at surgery (C) and residual cancer burden score at surgery (D). The data is represented as mean of the score of BTSH or BTRH gene signature expression. Each sample is indicated by +. RCB: residual cancer burden

