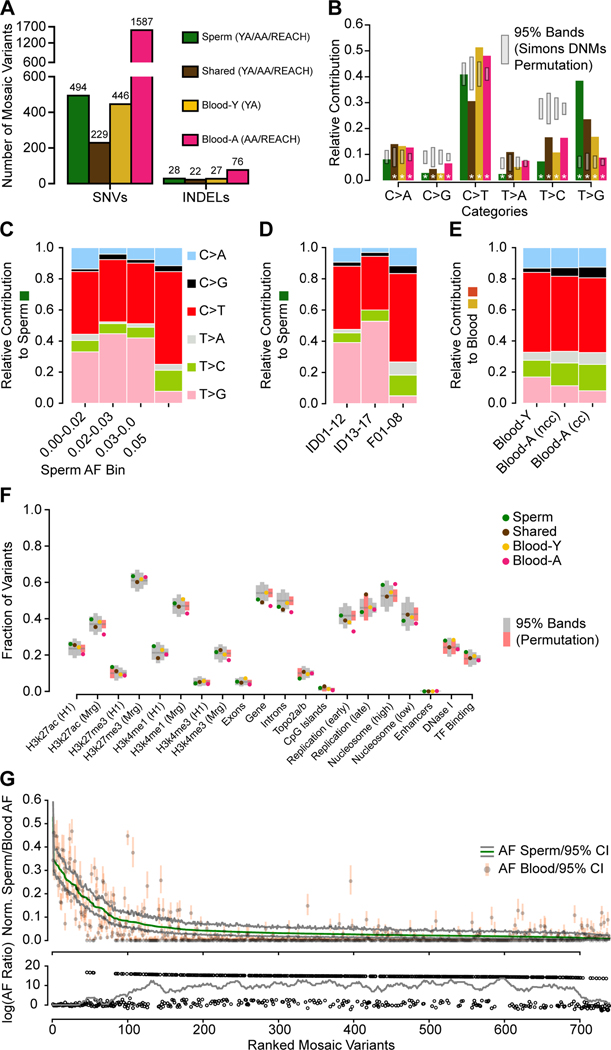
Figure 4. Distinct early developmental signatures distinguish Shared and tissue-specific clonal mosaicism.
(A) Combination of the YA (n=12), AA (n=5), and REACH (n=8) cohorts. Blood-Y from YA, Blood-A from AA and REACH (n=13) were analyzed separately for SNVs and INDELs. Sperm and Shared variants were combined across all cohorts (n=25).
(B) Bar charts show the base substitution profiles of variant classes from panel A. All mosaic classes showed depletion of the aging T>C substitution supporting their origin during embryogenesis. Grey: 95% CI from 10,000 permutations of Simons Simplex Cohort Control de novo mutations (Simons DNMs). Asterisks: data points outside of the 95% permutation CI.
(C-E) Relative contribution of 6-category variant base substitution profiles. (C) C>T predominance and an additional T>G enrichment only in sperm samples with AF < 5%. (D) After distinguishing the cohorts into different sequencing groups, the higher read depths used in ID01–17 (i.e. 300×) likely accounted for the greater sensitivity to detect this T>G signature. (YA: ID01–12, AA: ID13–17, REACH: F01–08). (E) After distinguishing cohorts into those with and without evidence of clonal hematopoiesis, C>T relative contribution correlated with stronger clonal collapse in blood. nCH, non-clonal hematopoiesis (ID13, ID15, and ID16), CH, clonal hematopoiesis (ID14 and ID17).
(F) Scatter plot showing the fraction of variants located across genomic regions for the six categories based on tissue distribution. H3k27ac/H3k27me3/H3K4me1 (H1/Mrg): H3k27ac/H3k27me3/H3K4me1 acetylation peak regions measured in human H1esc or merged from 9 different cell lines; Top2a/b: topoisomerase binding regions; Early and Late replication: measured DNA replication timing; Nucleosome (high/low): nucleosome occupancy tendency; Enhancers: annotated enhancer regions; DNase I: DNase I hypersensitive regions; TF Binding: Transcription factor binding sites. 95% permutation CIs were calculated from 10,000 random permutations of the same number of variants of Simons Simplex Consortium de novo mutations (if a data point is outside of the permutation interval it is colored red). Blood-A showed the most deviations from expectations.
(G) Rank plot of estimated sperm and blood AF with 95% confidence intervals for all 773 gonadal mosaic variants detected as mosaic in sperm (Sperm and Shared). Lower plot shows the log10 transformed ratio of sperm and blood AFs (0 replaced by 1e-8) and the rolling average of over 20 data points to display the local trend. Sperm variants reached maximal AF of 15% and showed a relatively lower average AF.

